Inicio
» Noticias
»
Order Blocks and Smart Money Concepts on Crypto Charts: What They Show—and What They Don’t
Order Blocks and Smart Money Concepts on Crypto Charts: What They Show—and What They Don’t
The most useful way to apply Smart Money Concepts (SMC) to crypto is to treat them as a structured chart-reading framework—not as proof that institutions are secretly controlling every move. Order blocks, breaks of structure, fair value gaps, and liquidity sweeps can help you organize price action and define entries, invalidation points, and targets. They become much less reliable when traders treat every candle zone as institutional evidence or assume an SMC label predicts the next move by itself.
That distinction matters in crypto because markets trade around the clock, liquidity differs sharply across venues, and leveraged positioning can produce violent moves that look meaningful on a chart but have several possible causes. The best use of SMC is therefore conditional: identify market structure first, mark a potential reaction zone, then look for confirmation from price, volume, and—when available—the actual order book.
Important limitation: terms such as “order block,” “break of structure” (BOS), “change of character” (CHoCH), “fair value gap” (FVG), and “liquidity sweep” are widely used trader vocabulary, but there is no single exchange, regulator, or academic standard that defines the full SMC framework. The definitions below use common trading conventions and should be tested rather than treated as objective market laws.
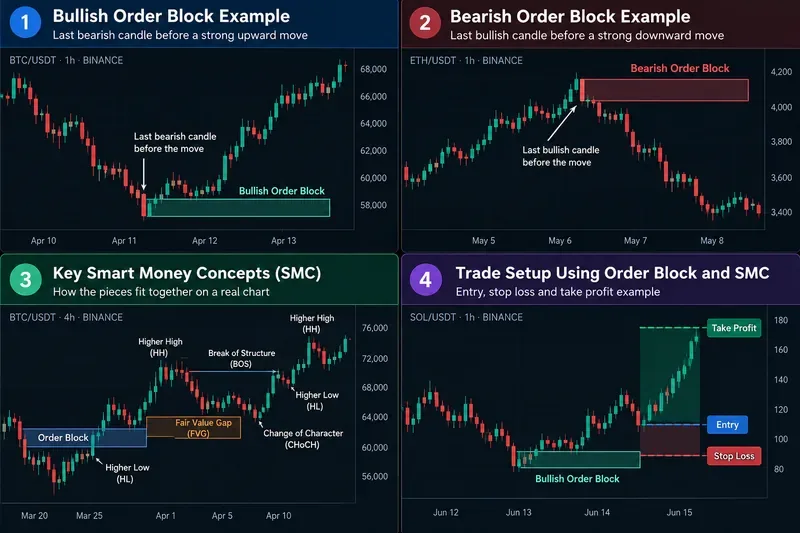
A practical SMC chart map: order blocks are treated as candidate reaction zones, while market structure and invalidation determine whether a setup remains valid. Prices and labels are illustrative, not live trade signals.
What is an order block in practical terms?
An order block is usually marked as the final opposing candle or small consolidation area before a strong directional move that breaks a meaningful swing level. In a bullish setup, traders often mark the last bearish candle before an impulsive rally. In a bearish setup, they often mark the last bullish candle before a sharp decline.
The useful idea is not that the candle contains a visible cache of “institutional orders.” A candlestick chart does not reveal who placed each order. The useful idea is that the zone gives you a precise area to watch if price returns.
For example, imagine BTC trades between $66,000 and $67,000, prints one final bearish hourly candle down to $65,700, then rallies strongly through a prior swing high at $68,000. A trader might mark the bearish candle's range as a bullish order block. If BTC later returns to that area, the zone becomes interesting only if buyers actually respond. If price closes decisively through it, the thesis is weakened or invalidated.
How does market structure fit into SMC?
Market structure is the foundation. Before drawing order blocks, classify the sequence of swings.
Higher high (HH): price exceeds the prior significant swing high.
Higher low (HL): a pullback holds above the prior significant swing low.
Lower high (LH): a rebound fails below the prior significant swing high.
An uptrend normally contains higher highs and higher lows. A downtrend normally contains lower lows and lower highs. This is basic price structure, and it is more objective than many later SMC labels because the swing points are visible on the chart.
What is a Break of Structure (BOS)?
A Break of Structure generally means price breaks a prior swing in the direction of the prevailing trend. In an uptrend, a move above the previous meaningful high can be labeled bullish BOS. In a downtrend, a move below the previous low can be labeled bearish BOS.
The word meaningful is important. If you mark every tiny intrabar high and low, almost every chart will produce constant “structure breaks.” Choose a timeframe and swing definition before analyzing the setup.
What is a Change of Character (CHoCH)?
A Change of Character is commonly used for an early break against the existing trend. If a market has been making higher highs and higher lows, then falls through a prior higher low, some traders call that a bearish CHoCH. It is a warning that the existing structure may be changing, not proof that a full reversal has begun.
That distinction prevents one of the most common SMC mistakes: shorting immediately after the first bearish break in a strong uptrend. A CHoCH can lead to a reversal, but it can also be a deeper pullback before the original trend resumes.
What is a fair value gap, and should you expect it to fill?
A fair value gap (FVG) is a three-candle pattern used to describe a fast move that leaves little or no overlap between the first and third candle around the middle candle's impulse. Traders interpret the zone as an area where price moved quickly and may later revisit.
The phrase can be misleading. Nothing guarantees that the market considers the zone “fair,” and price does not have to return to it. A better description is an imbalance zone on the chart.
Volume tools can provide a more directly measurable complement. TradingView's official documentation explains that Volume Profile shows how much activity occurred at different price levels and identifies levels such as the Point of Control (POC), where the most volume traded in the selected period. TradingView also explicitly describes Volume Profile as a reactive tool based on what has already happened, rather than a prediction of what must happen next. See TradingView's Volume Profile documentation.
What does “liquidity sweep” mean on a crypto chart?
In SMC language, a liquidity sweep usually means price briefly trades beyond an obvious prior high or low and then reverses. The idea is that stop orders and breakout orders tend to cluster around visible levels, so a move through those levels can trigger concentrated execution.
The chart alone does not prove who caused the move or whether it was deliberately engineered. On an exchange, actual liquidity is represented by resting bids and asks in the order book. Coinbase's official Advanced Trade documentation describes the order book as the current ladder of open orders, and its depth chart as a visual representation of bid and ask orders together with cumulative size. That data is observable; the intention behind a sweep is not. See the Coinbase Advanced dashboard documentation.
A more disciplined interpretation is therefore: “price traded through a prior high, then failed to hold above it,” rather than “smart money hunted every retail stop.” The first statement is visible and testable; the second requires knowledge the chart does not provide.
How do you apply an order block to an actual crypto setup?
Consider a hypothetical BTC/USDT four-hour chart.
Define the trend. BTC has formed a higher low at $64,000 and then a higher high at $70,000.
Identify the impulse that caused the BOS. The rally from $65,200 to $70,000 breaks the prior high at $68,500.
Mark the candidate order block. The final bearish candle before that impulse spans approximately $64,900 to $65,600.
Wait for the return. Do not assume the zone will hold. Let price retrace into it.
Require a response. Examples include rejection wicks, a lower-timeframe structure shift back upward, increased buying volume, or a failure to sustain closes below the zone.
Define invalidation. A decisive close beneath the block and the swing low may invalidate the long thesis.
Choose a target based on structure. Prior highs, a liquidity area, or a measured risk-to-reward objective can provide a clearer exit than “hold until it pumps.”
The order block is only one input in this sequence. The actual trade logic comes from location + structure + confirmation + invalidation.
¿Cuándo es más fuerte un bloque de órdenes?
No existe un sistema de puntuación universalmente validado, pero una zona suele ser más útil cuando coinciden varias condiciones observables:
Condición
Por qué puede ser importante
Precede a una clara ruptura estructural.
La zona está vinculada a una expansión de precios significativa, en lugar de a una vela arbitraria.
El impulso es fuerte y relativamente limpio.
Esto demuestra que el precio abandonó la zona con una clara dirección.
La zona no ha sido visitada repetidamente
Las pruebas repetidas pueden disminuir la utilidad práctica de un área de reacción.
La estructura de marco temporal superior coincide.
Un bloqueo alcista de una hora dentro de una tendencia alcista diaria tiene un contexto diferente al de uno que se encuentra directamente debajo de una resistencia diaria importante.
Los datos de volumen o del libro de órdenes respaldan la reacción.
Esto aporta evidencia cuantificable más allá de la etiqueta SMC.
La invalidación está cerca y es lógica.
Es más fácil gestionar una instalación cuando el límite del riesgo está claro.
¿Cuándo se debe ignorar un bloqueo de órdenes?
Ignóralo cuando tengas que forzar la definición. Si un gráfico contiene diez bloques superpuestos, tres FVG en competencia y múltiples etiquetas BOS posibles, el marco ya no reduce la incertidumbre.
También tenga cuidado cuando:
El bloque aparece en medio de un rango irregular sin desplazamiento significativo;
El precio ya ha pasado por esa zona varias veces;
La configuración entra en conflicto con la estructura dominante de marcos temporales superiores;
El mercado está muy poco activo y unas pocas operaciones pueden distorsionar las velas;
Un evento macroeconómico programado o un evento específico de la bolsa está generando una volatilidad anormal;
La parada requerida es tan amplia que el riesgo ya no se ajusta a su plan.
¿Puede el libro de pedidos confirmar una configuración SMC?
Puede aportar contexto, pero no debe considerarse una confirmación absoluta. Las órdenes pendientes pueden cancelarse antes de su ejecución, y la profundidad visible en una plataforma de intercambio representa a esa plataforma, no a todo el mercado global de criptomonedas.
Sin embargo, el libro de órdenes proporciona datos que las etiquetas de las velas japonesas no pueden ofrecer. Coinbase explica que las órdenes de los creadores de mercado se encuentran en el libro, mientras que las órdenes que se ejecutan inmediatamente contra la liquidez existente son órdenes de los tomadores de mercado. Por lo tanto, un operador que observa un bloque de órdenes alcistas puede plantearse preguntas prácticas: ¿Aparece profundidad de oferta cerca de la zona? ¿Se está ampliando el diferencial? ¿Los compradores están absorbiendo repetidamente la presión de venta? ¿Se están realizando operaciones realmente en esa zona?
¿Cómo puede el Perfil de Volumen mejorar el análisis de SMC?
El perfil de volumen puede ayudar a distinguir una zona visualmente atractiva de una donde realmente se produjo actividad comercial significativa. TradingView define el punto de control como el nivel de precio con el mayor volumen negociado durante el período seleccionado y el área de valor como el rango que contiene un porcentaje de volumen elegido, generalmente el 70 % por defecto.
Si un bloque de órdenes se superpone a un nodo de alto volumen, puede representar un área donde el mercado aceptó previamente el precio. Si se encuentra en una región de bajo volumen, el precio podría moverse más rápidamente. Ninguno de estos resultados está garantizado, pero el perfil de volumen ofrece una razón tangible para tratar de manera diferente dos bloques visualmente similares.
¿Deberías usar SMC en Bitcoin, altcoins o en ambos?
Este marco se puede aplicar a ambos, pero la calidad de la liquidez es fundamental. El BTC y los pares principales generalmente ofrecen mercados más profundos y una determinación de precios más continua que las altcoins con poca liquidez. En activos de baja liquidez, una orden grande puede generar una caída drástica, un aparente barrido de liquidez o una "barrida de liquidez" que parece estructuralmente importante, pero que en realidad es consecuencia de la escasa profundidad del mercado.
Si estás aprendiendo el marco de trabajo, comienza con pares líquidos y un marco temporal consistente. Esto facilita la comparación de configuraciones y reduce la probabilidad de que la microestructura aleatoria del mercado domine el gráfico.
¿Qué plazo funciona mejor?
No existe un plazo óptimo universal. Un enfoque práctico consiste en separar el contexto de la ejecución .
Por ejemplo, utilice el gráfico diario o de cuatro horas para determinar la estructura general del swing y los principales bloques de órdenes, y luego utilice el gráfico de una hora o de 15 minutos para buscar una entrada más precisa. Si el marco temporal inferior muestra un CHoCH alcista dentro de un bloque de órdenes alcista en un marco temporal superior, ambas capas respaldan la misma tesis.
El peligro reside en insistir hasta encontrar la señal deseada. Si la tendencia diaria es bajista, el gráfico de cuatro horas se encuentra en una resistencia y se sigue analizando el gráfico de cinco minutos hasta encontrar una señal alcista, el proceso se ha convertido en una búsqueda de confirmación en lugar de un análisis.
¿Cuál es el mayor error que cometen los operadores con SMC?
El mayor error es confundir las etiquetas con las causas. Un rectángulo llamado "bloque de órdenes" no obliga al precio a rebotar. Un máximo anterior llamado "liquidez" no garantiza una búsqueda de stop-loss. Una brecha de valor justo no tiene por qué cerrarse. BOS y CHoCH no eliminan las rupturas falsas.
SMC resulta más útil cuando te ayuda a crear un plan comercial que se pueda refutar:
Contexto: ¿Cuál es la estructura de marco temporal superior?
Ubicación: ¿Por qué es importante esta zona?
Desencadenante: ¿Qué debe hacer el precio antes de entrar en el mercado?
Invalidación: ¿Qué comportamiento específico demuestra que la idea es errónea?
Objetivo: ¿Dónde se obtendrán las ganancias?
Riesgo: ¿Cuánto estás dispuesto a perder si la instalación falla?
Si no se pueden responder esas preguntas, añadir más terminología de SMC no mejorará la configuración.
¿SMC te da alguna ventaja en el mundo de las criptomonedas?
Puede resultar ventajoso si las reglas están definidas con la precisión suficiente para realizar pruebas y si mejoran las entradas, salidas o el control de riesgos. No supone una ventaja simplemente porque un gráfico pueda etiquetarse a posteriori.
Una prueba útil consiste en recopilar entre 50 y 100 ejemplos utilizando el mismo par, marco temporal, definición de BOS, definición de bloque de órdenes, disparador de entrada y regla de stop. Realice un seguimiento del resultado tras deducir las comisiones y el deslizamiento. Si redibuja constantemente las zonas o redefine CHoCH tras observar el resultado, el marco no podrá evaluarse objetivamente.
Esto es especialmente importante cuando se utiliza apalancamiento. La Comisión de Comercio de Futuros de Productos Básicos de EE. UU. advierte que el apalancamiento amplifica tanto las ganancias como las pérdidas en los derivados de criptomonedas. Una configuración SMC técnicamente elegante aún puede generar una gran pérdida si el tamaño de la posición es excesivo. Consulte el aviso de riesgo de la CFTC sobre el comercio de criptomonedas .
En resumen
Los bloques de órdenes y los conceptos de Smart Money se utilizan mejor como un mapa, no como un motor de predicción. La mayor fortaleza del marco reside en su insistencia en la estructura, la ubicación y la invalidación del mercado. Su mayor debilidad radica en la tentación de atribuir intenciones institucionales ocultas a cada movimiento.
En los gráficos de criptomonedas, comience con la estructura observable. Marque solo los bloques de órdenes conectados a un desplazamiento significativo o una ruptura estructural. Utilice los FVG y los barridos de liquidez como contexto, no como certeza. Verifique el volumen y, cuando sea posible, la profundidad real del libro de órdenes. Lo más importante es definir el punto en el que la operación es errónea antes de entrar.
Si una configuración SMC no se puede describir mediante reglas que otro operador pueda reproducir sin ver las velas futuras, probablemente sea demasiado subjetiva como para confiar en ella con dinero real.