Início
» Notícia
»
Order Blocks and Smart Money Concepts on Crypto Charts: What They Show—and What They Don’t
Order Blocks and Smart Money Concepts on Crypto Charts: What They Show—and What They Don’t
The most useful way to apply Smart Money Concepts (SMC) to crypto is to treat them as a structured chart-reading framework—not as proof that institutions are secretly controlling every move. Order blocks, breaks of structure, fair value gaps, and liquidity sweeps can help you organize price action and define entries, invalidation points, and targets. They become much less reliable when traders treat every candle zone as institutional evidence or assume an SMC label predicts the next move by itself.
That distinction matters in crypto because markets trade around the clock, liquidity differs sharply across venues, and leveraged positioning can produce violent moves that look meaningful on a chart but have several possible causes. The best use of SMC is therefore conditional: identify market structure first, mark a potential reaction zone, then look for confirmation from price, volume, and—when available—the actual order book.
Important limitation: terms such as “order block,” “break of structure” (BOS), “change of character” (CHoCH), “fair value gap” (FVG), and “liquidity sweep” are widely used trader vocabulary, but there is no single exchange, regulator, or academic standard that defines the full SMC framework. The definitions below use common trading conventions and should be tested rather than treated as objective market laws.
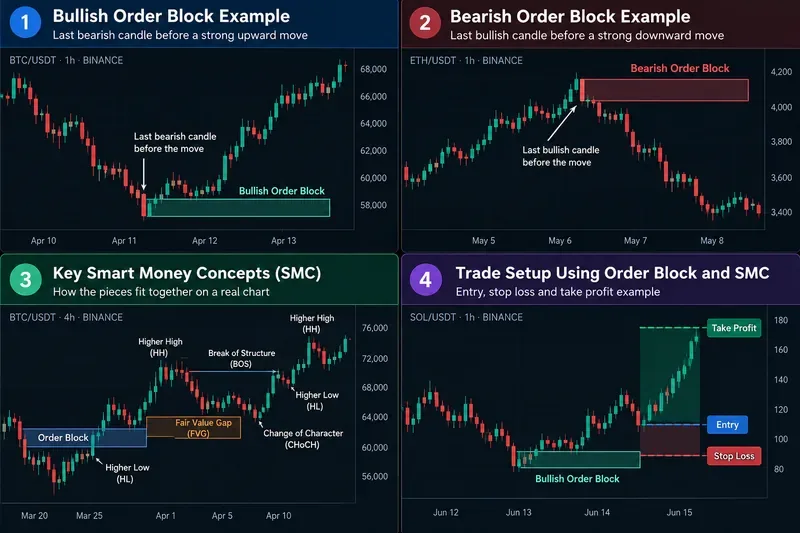
A practical SMC chart map: order blocks are treated as candidate reaction zones, while market structure and invalidation determine whether a setup remains valid. Prices and labels are illustrative, not live trade signals.
What is an order block in practical terms?
An order block is usually marked as the final opposing candle or small consolidation area before a strong directional move that breaks a meaningful swing level. In a bullish setup, traders often mark the last bearish candle before an impulsive rally. In a bearish setup, they often mark the last bullish candle before a sharp decline.
The useful idea is not that the candle contains a visible cache of “institutional orders.” A candlestick chart does not reveal who placed each order. The useful idea is that the zone gives you a precise area to watch if price returns.
For example, imagine BTC trades between $66,000 and $67,000, prints one final bearish hourly candle down to $65,700, then rallies strongly through a prior swing high at $68,000. A trader might mark the bearish candle's range as a bullish order block. If BTC later returns to that area, the zone becomes interesting only if buyers actually respond. If price closes decisively through it, the thesis is weakened or invalidated.
How does market structure fit into SMC?
Market structure is the foundation. Before drawing order blocks, classify the sequence of swings.
Higher high (HH): price exceeds the prior significant swing high.
Higher low (HL): a pullback holds above the prior significant swing low.
Lower high (LH): a rebound fails below the prior significant swing high.
An uptrend normally contains higher highs and higher lows. A downtrend normally contains lower lows and lower highs. This is basic price structure, and it is more objective than many later SMC labels because the swing points are visible on the chart.
What is a Break of Structure (BOS)?
A Break of Structure generally means price breaks a prior swing in the direction of the prevailing trend. In an uptrend, a move above the previous meaningful high can be labeled bullish BOS. In a downtrend, a move below the previous low can be labeled bearish BOS.
The word meaningful is important. If you mark every tiny intrabar high and low, almost every chart will produce constant “structure breaks.” Choose a timeframe and swing definition before analyzing the setup.
What is a Change of Character (CHoCH)?
A Change of Character is commonly used for an early break against the existing trend. If a market has been making higher highs and higher lows, then falls through a prior higher low, some traders call that a bearish CHoCH. It is a warning that the existing structure may be changing, not proof that a full reversal has begun.
That distinction prevents one of the most common SMC mistakes: shorting immediately after the first bearish break in a strong uptrend. A CHoCH can lead to a reversal, but it can also be a deeper pullback before the original trend resumes.
What is a fair value gap, and should you expect it to fill?
A fair value gap (FVG) is a three-candle pattern used to describe a fast move that leaves little or no overlap between the first and third candle around the middle candle's impulse. Traders interpret the zone as an area where price moved quickly and may later revisit.
The phrase can be misleading. Nothing guarantees that the market considers the zone “fair,” and price does not have to return to it. A better description is an imbalance zone on the chart.
Volume tools can provide a more directly measurable complement. TradingView's official documentation explains that Volume Profile shows how much activity occurred at different price levels and identifies levels such as the Point of Control (POC), where the most volume traded in the selected period. TradingView also explicitly describes Volume Profile as a reactive tool based on what has already happened, rather than a prediction of what must happen next. See TradingView's Volume Profile documentation.
What does “liquidity sweep” mean on a crypto chart?
In SMC language, a liquidity sweep usually means price briefly trades beyond an obvious prior high or low and then reverses. The idea is that stop orders and breakout orders tend to cluster around visible levels, so a move through those levels can trigger concentrated execution.
The chart alone does not prove who caused the move or whether it was deliberately engineered. On an exchange, actual liquidity is represented by resting bids and asks in the order book. Coinbase's official Advanced Trade documentation describes the order book as the current ladder of open orders, and its depth chart as a visual representation of bid and ask orders together with cumulative size. That data is observable; the intention behind a sweep is not. See the Coinbase Advanced dashboard documentation.
A more disciplined interpretation is therefore: “price traded through a prior high, then failed to hold above it,” rather than “smart money hunted every retail stop.” The first statement is visible and testable; the second requires knowledge the chart does not provide.
How do you apply an order block to an actual crypto setup?
Consider a hypothetical BTC/USDT four-hour chart.
Define the trend. BTC has formed a higher low at $64,000 and then a higher high at $70,000.
Identify the impulse that caused the BOS. The rally from $65,200 to $70,000 breaks the prior high at $68,500.
Mark the candidate order block. The final bearish candle before that impulse spans approximately $64,900 to $65,600.
Wait for the return. Do not assume the zone will hold. Let price retrace into it.
Require a response. Examples include rejection wicks, a lower-timeframe structure shift back upward, increased buying volume, or a failure to sustain closes below the zone.
Define invalidation. A decisive close beneath the block and the swing low may invalidate the long thesis.
Choose a target based on structure. Prior highs, a liquidity area, or a measured risk-to-reward objective can provide a clearer exit than “hold until it pumps.”
The order block is only one input in this sequence. The actual trade logic comes from location + structure + confirmation + invalidation.
Quando um bloco de ordens é mais forte?
Não existe um sistema de pontuação universalmente validado, mas uma zona geralmente é mais útil quando várias condições observáveis coincidem:
Doença
Por que isso pode ser importante
Isso precede uma clara ruptura estrutural.
A zona está ligada a uma expansão significativa de preços, e não a uma vela aleatória.
O impulso é forte e relativamente limpo.
Isso demonstra que o preço saiu da área com convicção direcional.
A zona não foi revisitada repetidamente.
Testes repetidos podem diminuir a utilidade prática de uma área de reação.
A estrutura de prazo superior concorda.
Um bloco de alta de uma hora dentro de uma tendência de alta diária tem um contexto diferente de um bloco posicionado diretamente abaixo de uma resistência diária importante.
Os dados de volume ou de carteira de pedidos corroboram a reação.
Isso adiciona evidências mensuráveis além do rótulo SMC.
A invalidação é próxima e lógica.
Um ambiente de teste é mais fácil de gerenciar quando os limites de risco estão bem definidos.
Quando você deve ignorar um bloqueio de ordens?
Ignore isso quando precisar forçar a definição. Se um gráfico contiver dez blocos sobrepostos, três FVGs concorrentes e vários rótulos BOS possíveis, a estrutura não estará mais reduzindo a incerteza.
Tenha cautela também quando:
O bloco aparece no meio de uma faixa irregular, sem deslocamento significativo;
O preço já passou por essa zona diversas vezes;
A configuração entra em conflito com a estrutura dominante de prazos mais longos;
O mercado está extremamente líquido e algumas poucas negociações podem distorcer os candles;
Um evento macro programado ou um evento específico da bolsa está criando volatilidade anormal;
A distância de parada necessária é tão grande que o risco já não se encaixa no seu plano.
O livro de ordens pode confirmar uma configuração SMC?
Isso pode adicionar contexto, mas não deve ser tratado como confirmação perfeita. Ordens pendentes podem ser canceladas antes da execução, e a profundidade visível em uma corretora representa aquela plataforma, não todo o mercado global de criptomoedas.
Ainda assim, o livro de ofertas fornece dados que os rótulos dos candlesticks não conseguem transmitir. A Coinbase explica que as ordens de maker (criadores de mercado) são registradas no livro de ofertas, enquanto as ordens que são executadas imediatamente contra a liquidez existente são ordens de taker (tomadores de mercado). Um trader que observa um bloco de ordens de alta pode, portanto, fazer perguntas práticas: a profundidade da oferta está aparecendo perto da zona? O spread está aumentando? Os compradores estão absorvendo repetidamente a pressão de venda? As negociações estão realmente ocorrendo ali?
Como o Perfil de Volume pode aprimorar a análise SMC?
O Perfil de Volume pode ajudar a distinguir uma zona visualmente atraente de uma onde realmente ocorreu atividade de negociação significativa. O TradingView define o Ponto de Controle como o nível de preço com o maior volume negociado durante o período selecionado e a área de valor como o intervalo que contém uma porcentagem escolhida do volume, geralmente 70% por padrão.
Se um bloco de ordens se sobrepõe a um nó de alto volume, isso pode representar uma área onde o mercado já aceitou o preço anteriormente. Se estiver em uma região de baixo volume, o preço pode se mover mais rapidamente por ela. Nenhum dos resultados é garantido, mas o perfil de volume fornece uma razão mensurável para tratar dois blocos visualmente semelhantes de forma diferente.
Você deve usar o SMC em Bitcoin, altcoins ou ambos?
A estrutura pode ser aplicada a ambos, mas a qualidade da liquidez é importante. O BTC e os principais pares geralmente oferecem mercados mais profundos e uma descoberta de preços mais contínua do que as altcoins com baixa liquidez. Em ativos de baixa liquidez, uma grande ordem pode criar um pavio dramático, um aparente BOS (Blowout Suspension) ou uma "varredura de liquidez" que parece estruturalmente importante, mas é principalmente consequência da pouca profundidade do mercado.
Se você está aprendendo a estrutura, comece com pares líquidos e um período gráfico consistente. Isso facilita a comparação de configurações e reduz a chance de que a microestrutura aleatória do mercado domine o gráfico.
Qual o melhor período de tempo?
Não existe um prazo ideal universal. Uma abordagem prática é separar o contexto da execução .
Por exemplo, use o gráfico diário ou de quatro horas para determinar a estrutura geral de oscilação e os principais blocos de ordens e, em seguida, use o gráfico de uma hora ou de 15 minutos para procurar uma entrada mais precisa. Se o período de tempo menor mostrar um CHoCH de alta dentro de um bloco de ordens de alta em um período de tempo maior, as duas camadas corroboram a mesma tese.
O perigo reside em insistir na análise até encontrar o sinal desejado. Se a tendência diária for de baixa, o gráfico de quatro horas estiver em resistência e você continuar analisando dados de cinco minutos até encontrar um sinal de baixa de suporte (BOS) de alta, o processo terá se tornado uma busca por confirmação em vez de uma análise propriamente dita.
Qual é o maior erro que os investidores cometem com a SMC?
O maior erro é tratar rótulos como causas. Um retângulo chamado "bloco de ordens" não força o preço a se recuperar. Uma alta anterior chamada "liquidez" não garante uma caçada a stops. Um gap de valor justo não precisa ser preenchido. BOS e CHoCH não eliminam falsos rompimentos.
O SMC é mais útil quando ajuda a criar um plano de negociação falsificável:
Contexto: Qual é a estrutura de prazo superior?
Localização: Por que essa zona é importante?
Gatilho: O que o preço deve fazer antes da entrada?
Invalidação: Que comportamento específico prova que a ideia está errada?
Objetivo: Para onde irão os lucros?
Risco: Quanto você está disposto a perder se a configuração falhar?
Se essas perguntas não puderem ser respondidas, adicionar mais terminologia SMC não melhorará a configuração.
O SMC oferece alguma vantagem em criptomoedas?
Pode proporcionar uma vantagem se as regras forem definidas com precisão suficiente para serem testadas e se melhorarem as suas entradas, saídas ou controlo de risco. Não proporciona uma vantagem simplesmente porque um gráfico pode ser rotulado posteriormente.
Um teste útil consiste em coletar pelo menos 50 a 100 exemplos usando o mesmo par de ordens, período, definição de BOS (Broadcast Overshift), definição de bloco de ordens, gatilho de entrada e regra de stop. Acompanhe o resultado após a dedução de taxas e slippage. Se você redesenhar constantemente as zonas ou redefinir o CHoCH (Current Hours and Controls) após observar o resultado, a estrutura não poderá ser avaliada objetivamente.
Isso é especialmente importante quando há alavancagem envolvida. A Comissão de Negociação de Futuros de Commodities dos EUA (CFTC) alerta que a alavancagem amplifica tanto os ganhos quanto as perdas em derivativos de moedas virtuais. Uma configuração SMC tecnicamente elegante ainda pode gerar uma grande perda se o tamanho da posição for excessivo. Consulte o aviso de risco da CFTC sobre negociação de moedas virtuais .
Resumindo
Os blocos de ordens e os conceitos de Smart Money são mais bem utilizados como um mapa do que como um mecanismo de previsão. O ponto forte da estrutura é a sua ênfase na estrutura, localização e invalidação do mercado. O ponto fraco é a tentação de atribuir intenções institucionais ocultas a cada oscilação.
Em gráficos de criptomoedas, comece observando a estrutura. Marque apenas os blocos de ordens conectados a deslocamentos significativos ou a uma quebra estrutural. Use os FVGs (Forward Volume Gains - Valores Futuros de Negociação) e as varreduras de liquidez como contexto, e não como certeza absoluta. Verifique o volume e, quando possível, a profundidade real do livro de ordens. Mais importante ainda, defina o ponto em que a operação está errada antes de entrar.
Se uma configuração SMC não puder ser descrita por regras que outro trader consiga reproduzir sem ver os candles futuros, provavelmente é demasiado subjetiva para se confiar dinheiro real nela.