Home
» Ecosystem
»
Impermanent Loss With Yield Incentives: A Worked Example Including Token Rewards
Impermanent Loss With Yield Incentives: A Worked Example Including Token Rewards
Impermanent loss is easiest to understand when the comparison is explicit: what is your liquidity-provider position worth now, and what would the same starting tokens be worth if you had simply held them? Yield incentives complicate that comparison because trading fees and reward tokens can partly or fully offset the shortfall.
This reference walks through one complete example using a simple 50/50, full-range constant-product pool. The numbers are illustrative rather than a forecast for any specific protocol. The key is to keep three buckets separate: the value of the LP position, fees earned, and the market value of any incentive tokens.
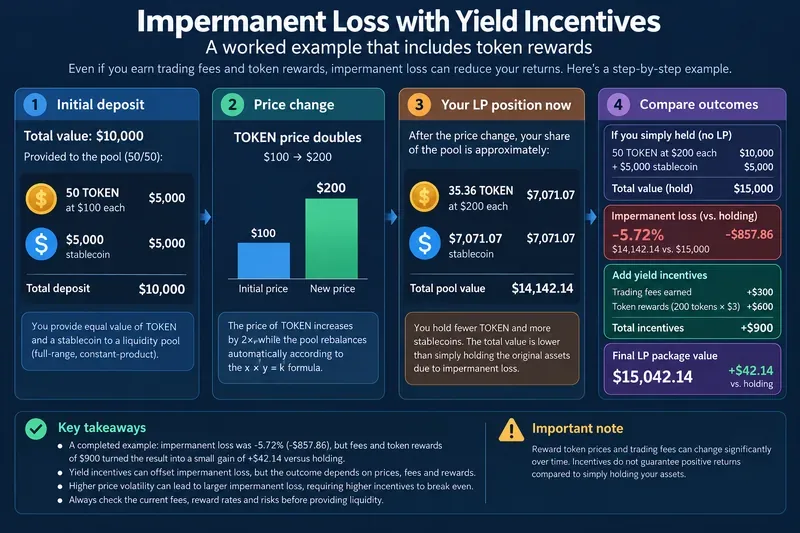
A $10,000 constant-product LP example in which a 2× token price move creates a $857.86 shortfall versus holding before $300 of fees and $600 of token rewards are added.
Quick reference: what should be included in the comparison?
Component
What it measures
Include it?
LP position value
Current market value of the tokens represented by the LP position
Yes
Hold benchmark
Current value of the original token quantities if they had never entered the pool
Yes
Trading fees
Fees attributable to the LP position over the measurement period
Yes, if they are not already reflected in the LP value you are using
Reward tokens
Current realizable value of additional incentive tokens earned
Yes, but mark the valuation time and token price
Gas, claim costs, taxes, hedging costs
Costs outside the AMM position itself
Include for a true net-return calculation
First, what impermanent loss actually means
For a classic constant-product AMM, reserves follow x × y = k. As relative market prices move and arbitrage trades rebalance the pool, an LP ends up holding different quantities of the two assets. Uniswap's developer documentation describes this constant-product mechanism and defines impermanent loss as the opportunity cost of providing liquidity relative to holding the tokens. See the Uniswap AMM overview and its v2 returns explanation.
A common misunderstanding is to treat impermanent loss as the same thing as losing money in dollar terms. It is not. An LP can be profitable versus the original deposit and still underperform the hold benchmark. The comparison is relative.
Practical action: always calculate both numbers—the current LP value and the current value of the original token quantities—using the same timestamp and prices.
Worked example: a $10,000 50/50 deposit
1. Set the starting position
Assume TOKEN trades at $100 and the other asset is a $1 stablecoin. You provide $10,000 of liquidity:
50 TOKEN × $100 = $5,000
5,000 stablecoins × $1 = $5,000
Total starting value = $10,000
For this simplified full-range constant-product example, your share can be treated as if its reserves were 50 TOKEN and 5,000 stablecoins. The invariant is therefore 50 × 5,000 = 250,000.
2. Let TOKEN double to $200
Now suppose the external market price rises from $100 to $200 while the stablecoin remains at $1. Arbitrage activity moves the AMM price toward the external price. With a 50/50 constant-product pool and no fees added to the reserves for this intermediate calculation, the new reserve quantities satisfy both x × y = 250,000 and y ÷ x = 200.
Solving those equations gives approximately:
35.3553 TOKEN
7,071.07 stablecoins
At the new market price, the LP position is worth about $14,142.14.
3. Calculate the hold benchmark
If you had simply held the original assets, you would still own 50 TOKEN and 5,000 stablecoins:
50 TOKEN × $200 = $10,000
5,000 stablecoins = $5,000
Hold benchmark = $15,000
The LP position is therefore $857.86 below the hold benchmark. Expressed as a percentage of the hold benchmark, impermanent loss is approximately -5.72%.
This matches the standard constant-product formula:
IL = 2√r ÷ (1 + r) - 1, where r is the new price divided by the starting price. With r = 2, IL is about -5.72%. Uniswap publishes the same formula in its returns documentation.
Practical action: do not stop at “my LP is worth $14,142, so I made money.” The relevant IL comparison is $14,142 versus the $15,000 hold benchmark, not versus the original $10,000 deposit.
Now add trading fees and token rewards
Suppose the position earned $300 in trading fees during the measurement period. Separately, assume an incentive program paid 200 reward tokens, and those tokens are worth $3 each at the time of the comparison. That makes the reward-token value $600.
Item
Value
LP position after price move
$14,142.14
Trading fees
+$300.00
200 reward tokens × $3
+$600.00
Total LP package
$15,042.14
Hold benchmark
$15,000.00
Difference after fees and rewards
+$42.14
In this example, the LP position underperforms holding by $857.86 before incentives. The $900 combination of fees and reward tokens slightly more than offsets that gap, leaving the LP package $42.14 ahead of holding.
This does not mean an advertised reward rate automatically eliminates impermanent loss. Reward programs may distribute separate tokens whose prices change, and trading-fee income depends on actual activity and the protocol's fee mechanics. Some DeFi protocols explicitly distribute governance or incentive tokens to liquidity participants; Curve's DAO whitepaper, for example, describes liquidity gauges that distribute CRV according to measured liquidity. See the Curve DAO whitepaper.
Practical action: value reward tokens at a price you could reasonably realize now, not solely at the price shown when the APR was first advertised.
What reward-token price is needed to break even?
The break-even calculation is useful because it turns a vague “high APY” claim into a specific threshold.
In the example, the gap versus holding is $857.86. Trading fees cover $300 of it, leaving $557.86 to be covered by 200 reward tokens. The break-even reward-token price is therefore:
($857.86 - $300) ÷ 200 = about $2.79 per reward token.
Reward-token price
Reward value
Total LP package
Result vs. holding
$1.00
$200
$14,642.14
-$357.86
$2.50
$500
$14,942.14
-$57.86
$3.00
$600
$15,042.14
+$42.14
$5.00
$1,000
$15,442.14
+$442.14
The table makes the tradeoff visible: the quantity of reward tokens can be fixed while their contribution to total return remains highly variable because their market price is not fixed.
Why the simple formula does not fit every LP position
The -5.72% result applies to the simplified full-range, 50/50 constant-product setup. It should not be copied directly to every AMM. Uniswap v3 and v4 can use concentrated liquidity, where a position is active only within a selected price range and its inventory behavior differs from a full-range v2-style position. Uniswap notes that concentrated positions earn fees only while active in range. See its liquidity-provision overview.
Other AMMs can use different asset weights, stable-swap curves, dynamic fees, hooks, or protocol-specific reward accounting. The correct benchmark therefore depends on the actual pool design.
Practical action: before applying a generic IL calculator, identify the AMM type, asset weights, price range, fee treatment, and whether rewards are automatically compounded or claimed separately.
Three mistakes that can make a yield number look better than it is
Counting rewards but ignoring the hold benchmark
Reporting “LP value plus rewards” without comparing it with simply holding the starting tokens can hide the opportunity cost created by rebalancing.
Action: put the hold value in the same table as the LP value, fees, and rewards.
Using the advertised reward price instead of the exit price
Reward tokens can rise or fall while they accrue. A projected APR calculated at one token price may not match the value ultimately realized.
Action: record both reward quantity and current price. Stress-test the result at lower reward-token prices.
Double-counting trading fees
Depending on how a dashboard reports position value, accrued fees may already be embedded in the assets shown or may appear separately. Adding them again can overstate returns.
Action: determine whether the displayed LP value is principal-only or principal plus accrued fees before adding a fee line item.
Practical checklist before calling an LP strategy profitable
Record the exact starting quantities of both assets, not only their dollar value.
Calculate what those original quantities would be worth now.
Measure the current withdrawable LP assets at the same prices.
Separate trading fees from principal unless the protocol already combines them.
Count reward tokens by quantity and current realizable price.
Check whether unclaimed rewards require gas or another transaction to realize.
Include protocol, smart-contract, token, stablecoin, and range risks where relevant. Uniswap's current risk overview lists impermanent loss alongside volatility, out-of-range positions, smart-contract vulnerabilities, and token-related risks in its liquidity-provider risk guidance.
Recalculate after large price moves; an APR snapshot is not a final return.
The useful bottom line
Yield incentives should be treated as a separate return stream, not as proof that impermanent loss has disappeared. In the worked example, a 2× relative price move creates a 5.72% shortfall versus holding. $300 of fees and $600 of token rewards are just enough to overcome that shortfall at a $3 reward-token price. If the reward token falls below roughly $2.79, all else equal, the example slips back below the hold benchmark.
The most reliable comparison is therefore simple: current LP assets + realizable fees + realizable rewards - costs versus the current value of the original tokens held outside the pool. That calculation turns a headline yield into a result you can actually evaluate.