Home
» News
»
October 2026 USDA WASDE Release: Exact Time and Crop Numbers Traders Compare
October 2026 USDA WASDE Release: Exact Time and Crop Numbers Traders Compare
The USDA has scheduled its October 2026 World Agricultural Supply and Demand Estimates (WASDE) report for Friday, October 9, at 12:00 p.m. Eastern Time. The National Agricultural Statistics Service (NASS) also lists its October Crop Production report for noon Eastern on the same date. That pairing matters: traders will compare USDA’s crop-size estimates with the supply-and-demand balance sheets that show how production changes affect projected stocks, exports, and use. As of September 29, USDA has not released October estimates, so there are no verified October crop numbers to report yet.
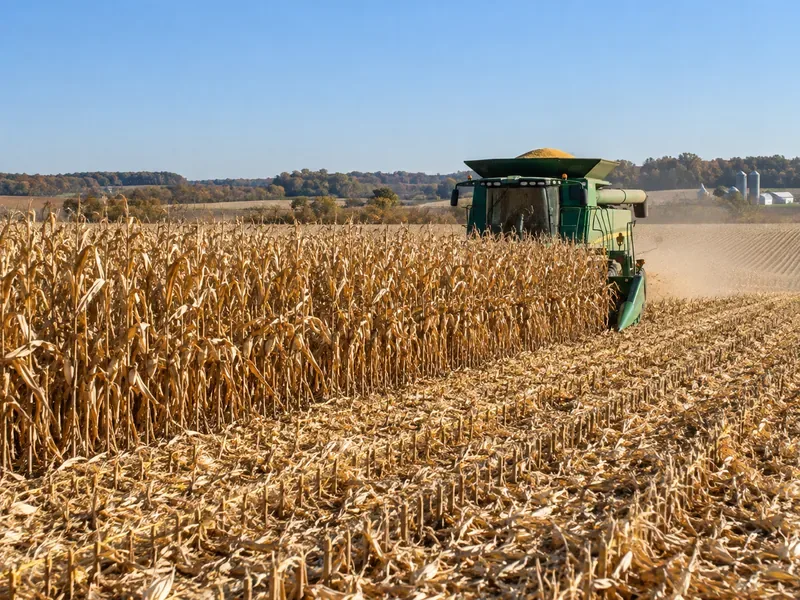
A combine harvests mature corn, the crop whose yield, production, and ending-stock estimates traders will compare in USDA’s October releases.
When is the October 2026 WASDE release?
The USDA’s official WASDE page lists October 9, 2026, at 12:00 p.m. ET on its 2026 release calendar. That is 11:00 a.m. Central Time. October 9 falls during daylight saving time in the United States, so the Eastern time zone is on EDT. Use the USDA page as the controlling source if the agency posts a schedule change.
NASS’s release calendar separately schedules Crop Production for October 9 at 12:00 p.m. ET. Traders may see both releases arrive at the same time, alongside other reports listed for that date. WASDE is prepared by USDA’s World Agricultural Outlook Board; NASS supplies much of the U.S. crop production forecast data. The reports answer connected but different questions: Crop Production estimates the size of the U.S. crop, while WASDE incorporates production and other inputs into a broader supply-and-use outlook for the United States and the world.
The latest WASDE available as of September 29 is the September 11 report. The October report is scheduled, but its estimates and tables are not available in advance. Treat any pre-release numbers circulating as analyst estimates or market expectations, not as USDA figures.
Which crop numbers will traders compare?
WASDE is a collection of balance sheets, not a single price forecast. A practical read starts with the crop estimates, then follows their effect through domestic use, trade, and ending stocks. For each crop, compare the October figures with three reference points: the September WASDE, the October NASS Crop Production report where relevant, and a clearly identified pre-report analyst consensus. Consensus is not an official USDA number, and different surveys can produce different averages.
Market
Key October figures
Why traders compare them
Corn
Harvested area, yield, production, beginning stocks, feed and residual use, ethanol and other food/industrial use, exports, and ending stocks
Yield and harvested acreage shape the crop-size estimate; export and domestic-use revisions determine how much of the crop is projected to remain at year-end.
Soybeans
Harvested area, yield, production, crush, exports, imports, and ending stocks; soybean meal and oil balances also matter
Changes to the U.S. crop are weighed against crush demand, export demand, and competing supplies from South America.
Wheat
Production, imports, food/feed/seed use, exports, and ending stocks; production by class and major exporting-country estimates add context
Wheat is traded across classes and regions, so the national total and the global trade picture both matter.
Global grain and oilseed balances
Production, domestic use, exports, imports, and ending stocks by major producing or consuming country
A change outside the United States can offset or amplify a U.S. supply revision in the globally traded market.
How to read the headline corn and soybean revisions
Start with yield, harvested area, and production
For corn and soybeans, traders often focus first on the yield estimate and harvested acreage. Production is derived from the area expected to be harvested and the yield per acre, subject to USDA’s published methods and rounding. A small yield revision applied across a large acreage base can materially change the estimated crop. Compare the October NASS estimate with September’s estimate and with the range of pre-report expectations; do not assume a higher yield automatically means a bearish market move, because the expected revision may already be reflected in prices.
The October Crop Production report is therefore a key companion to WASDE. When the production estimate changes, the WASDE balance sheet may also adjust the amount available for use. But production alone does not determine the ending-stocks number: imports, beginning stocks, exports, domestic use, and other balance-sheet components can change too.
Follow the balance sheet to ending stocks
A simplified supply identity is beginning stocks plus production and imports. USDA allocates that supply across domestic use and exports, leaving projected ending stocks. Traders commonly compare ending stocks in bushels for U.S. corn and soybeans and the implied stocks-to-use ratio, calculated as ending stocks divided by total use. The ratio offers context for how large the remaining buffer is relative to expected demand; it is not a stand-alone forecast of price direction.
For corn, feed and residual use, ethanol-related use, and exports are closely watched. For soybeans, crush and exports are central, with meal and oil balances providing additional information about processing demand. If production rises while demand projections also rise, ending stocks may move little. If production is unchanged but exports are cut, ending stocks can increase. Reading the linked rows shows whether a headline change came from supply, demand, or both.
Why wheat and world figures can change the interpretation
Wheat traders compare U.S. production and ending stocks with export availability and global supply from major producers. Wheat is not a single interchangeable pool: classes, quality, location, and shipping availability influence which supplies compete. A large global ending-stock number does not necessarily mean every class or export origin is plentiful. Follow the country and trade rows in the report, and compare like-for-like marketing years and units.
WASDE’s global tables include forecasts for production, trade, use, and ending stocks across countries. Revisions in South American soybean or corn output, Black Sea and European wheat supply, or demand in large importing markets can alter the world balance even when the U.S. estimate barely changes. Check whether a global total includes stocks held in countries with limited export availability, and avoid comparing metric tons with U.S. bushels without converting units correctly.
What changed before the October release?
One scheduled data point arrives before WASDE: NASS lists the September 30 Grain Stocks report at 12:00 p.m. ET. It reports stocks on hand at the start of September, providing an inventory snapshot as the new marketing year begins for corn and soybeans. It is a separate report, not part of the October 9 WASDE release, but traders may use it when assessing the starting-stock assumptions carried into later balance sheets. The actual stocks figure is not included here because the September 30 report has not yet been released as of September 29.
The order of events gives market participants a defined comparison sequence: first review the September 30 stocks data, then compare the October 9 Crop Production estimates and WASDE balance sheets with the September forecasts and pre-report expectations. USDA’s forecast process draws on surveys, market and trade data, weather information, analysis, and interagency judgment. Monthly estimates can be revised as new information becomes available, so an October figure should be read as the agency’s current estimate rather than a final harvest total.
A focused checklist for reading WASDE day
Confirm the release time and open the official USDA WASDE page and NASS release calendar.
Compare October U.S. production with September and the same-day Crop Production report.
Trace production revisions through beginning stocks, use, exports, and ending stocks.
Compare the published balance sheet with the specific analyst consensus you are using, keeping forecast values separate from USDA estimates.
Check global country tables and use consistent units and marketing years.
Look for later USDA revisions before treating a release-day number as settled.
The most useful result is a clear explanation of what changed and where the change came from: crop size, demand, exports, or inventories. If the headline production estimate moves but projected ending stocks do not, read the demand rows before drawing a conclusion. If the balance sheet changes because of foreign production or trade, a U.S.-only crop headline may miss the larger adjustment. WASDE provides a common official benchmark, but it does not remove uncertainty about weather, harvest results, exports, or subsequent revisions.