Home
» News
»
RSI Divergence Trading Guide: How to Spot Bullish and Bearish Trend Reversals
RSI Divergence Trading Guide: How to Spot Bullish and Bearish Trend Reversals
RSI divergence is a practical way to compare price structure with momentum. The idea is simple: when price pushes to a new swing extreme but the Relative Strength Index does not confirm that move, momentum may be weakening. That mismatch can warn of a possible reversal, but it is not a reversal by itself.
The Relative Strength Index (RSI), introduced by J. Welles Wilder, is a bounded momentum oscillator that moves between 0 and 100. TradingView’s current documentation defines RSI as a momentum oscillator and shows the standard formula, while Fidelity’s technical indicator guide notes the traditional 70 overbought and 30 oversold reference levels. See TradingView’s RSI documentation and Fidelity’s RSI guide.
RSI Divergence at a Glance
Pattern
Price
RSI
Typical interpretation
Regular bullish divergence
Lower low
Higher low
Downside momentum may be weakening; possible bullish reversal setup
Regular bearish divergence
Higher high
Lower high
Upside momentum may be weakening; possible bearish reversal setup
Hidden bullish divergence
Higher low
Lower low
Often interpreted as trend continuation in an uptrend
Hidden bearish divergence
Lower high
Higher high
Often interpreted as trend continuation in a downtrend
This guide focuses mainly on regular divergence because that is the form most traders use when looking for trend reversals. Charles Schwab distinguishes regular divergence from hidden divergence and describes hidden patterns as trend-continuation signals rather than reversal signals. See Schwab’s chart-divergence guide.
1. How to Spot Bullish RSI Divergence
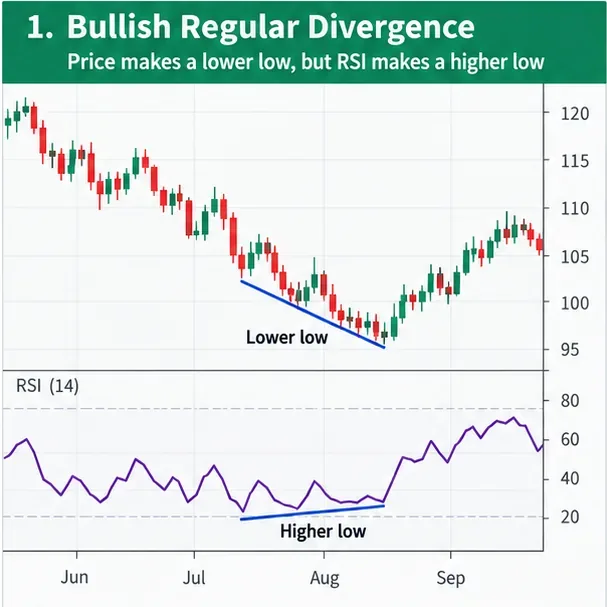
A regular bullish divergence forms when price makes a lower swing low while RSI makes a higher swing low. The price chart says sellers managed to push the market to a new low, but the oscillator says the latest downswing had less momentum than the previous one.
Regular bullish divergence: price makes a lower low while RSI makes a higher low, showing that downside momentum is no longer confirming the new price low.
Practical identification checklist
Start with two clear price swing lows rather than tiny intrabar fluctuations.
Confirm that the second price low is lower than the first.
Match those same two time points on the RSI panel.
Confirm that the second RSI low is higher than the first.
Do not enter simply because the two lines diverge; wait for price to provide confirmation appropriate to your method.
Confirmation can take several forms: a break above a nearby swing high, a break of a short-term downtrend line, a bullish reversal candle at a meaningful support area, or a shift in market structure from lower highs to higher highs. The purpose is not to find the “perfect” trigger but to avoid treating a momentum warning as if it were already a completed reversal.
2. How to Spot Bearish RSI Divergence
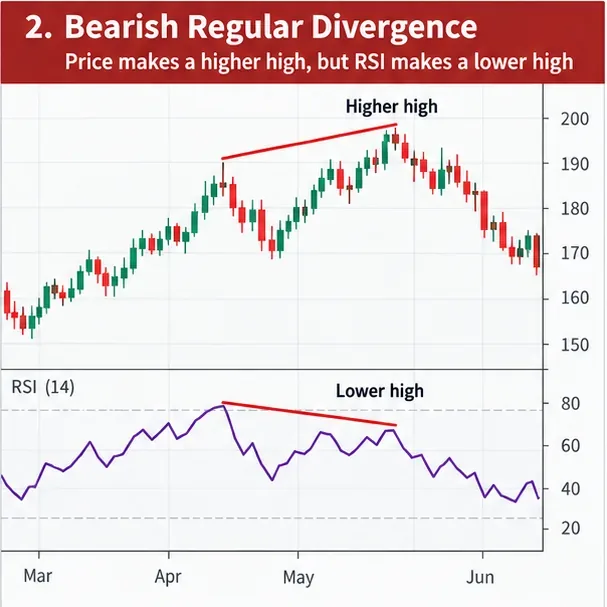
A regular bearish divergence forms when price makes a higher swing high while RSI makes a lower swing high. Price has extended the uptrend, but momentum has failed to make a corresponding new high.
Regular bearish divergence: price reaches a higher high, but the corresponding RSI peak is lower, indicating that upside momentum is not confirming the new price high.
Schwab describes this type of negative divergence as a situation in which price reaches a higher high while RSI reaches a lower high, which can signal slowing momentum and a possible reversal. That wording matters: “possible” is the correct frame. Divergence is evidence of deceleration, not proof that price must fall next.
What improves a bearish setup?
The second price high occurs near a prior resistance zone.
RSI rolls over after the second peak instead of immediately recovering.
Price loses a recent swing low or short-term support level.
The divergence appears after an extended advance rather than in the middle of a noisy range.
Volume, breadth, or another independent tool also shows weakening participation, if those tools are part of your process.
3. Wait for Confirmation Instead of Trading the Divergence Alone
The most common practical mistake is entering as soon as two diverging lines can be drawn. A better workflow separates the warning from the trigger. First identify divergence. Then ask what price would need to do to show that the old trend has actually lost control.
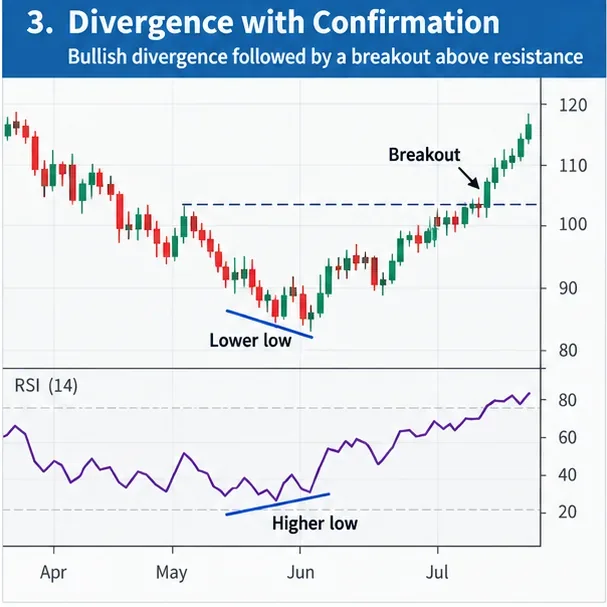
A bullish divergence becomes more actionable only after price confirms the idea—for example, by breaking above a nearby resistance level or prior swing high.
For a bullish setup, one simple confirmation method is a close above the most recent reaction high. For a bearish setup, the mirror image is a close below the latest reaction low. Traders who prefer earlier entries may use a trendline break or candle pattern, but earlier triggers generally carry more false-signal risk because less price evidence has accumulated.
4. Why RSI Divergence Fails
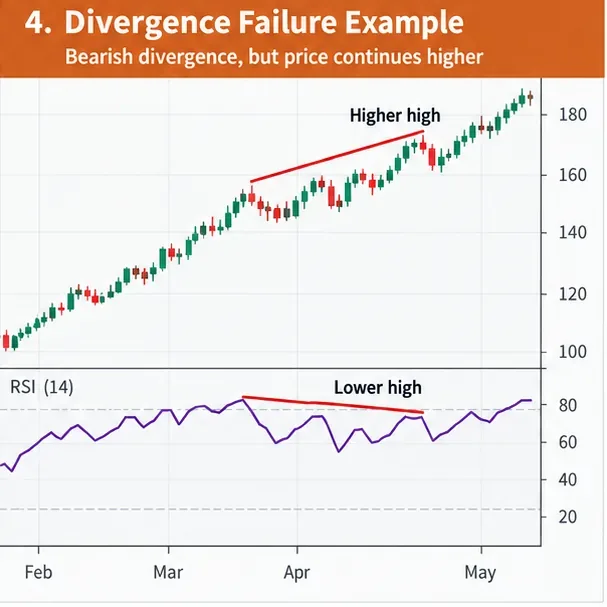
Divergence can persist for several swings while price continues in the original direction. This is especially important in strong trends. Fidelity explicitly warns that RSI can remain overbought or oversold for extended periods during strong trends. TradingView also cautions against using RSI as a single source for a trading decision.
Failure example: bearish divergence appears, but price continues higher. Divergence can persist in a strong trend, so a momentum mismatch should not be treated as an automatic reversal signal.
That failure mode explains why shorting every bearish divergence or buying every bullish divergence is risky. Momentum can slow without the trend ending. Price may simply consolidate, rotate, or continue at a slower rate before accelerating again.
Common failure conditions
Strong trend: persistent buying or selling pressure overwhelms the early momentum warning.
Poor swing selection: the trader compares unrelated pivots or minor noise instead of meaningful swings.
Different time horizons: a divergence on a five-minute chart may be irrelevant to a position based on a daily trend.
No price confirmation: the trader anticipates a reversal before market structure changes.
Late pattern recognition: the divergence is noticed only after much of the reversal has already occurred.
Choosing RSI Settings for Divergence
A 14-period RSI remains the standard starting point. TradingView’s help page lists 14 bars as the default RSI length and close as the default source. Shorter lengths react faster and create more oscillator swings, which can produce more divergence signals but also more noise. Longer lengths smooth momentum and may reduce signal frequency.
Setting choice
Effect
Practical trade-off
Shorter RSI length
More responsive
Earlier signals, more noise and false divergences
14-period default
Balanced responsiveness
Useful baseline for testing across markets and timeframes
Longer RSI length
Smoother
Fewer signals, often later but less sensitive to minor swings
There is no universal best setting for stocks, crypto, forex, or futures. If you change the RSI length, test it on the same market and timeframe you plan to trade and keep the rest of the process stable. Otherwise, it becomes difficult to tell whether performance changed because of the setting, the market regime, or random variation.
Do You Need RSI to Be Below 30 or Above 70?
No. Divergence does not technically require RSI to cross 30 or 70. A bullish divergence can form with both RSI lows above 30, and a bearish divergence can form with both RSI highs below 70. However, some traders prefer divergences near momentum extremes because the setup then combines two pieces of context: a momentum mismatch and an unusually stretched reading.
The 70/30 levels are reference zones rather than hard reversal points. Fidelity notes that these thresholds can be adjusted for the behavior of a particular security, and that RSI can stay at extreme readings during strong trends. Treat the levels as context, not as automatic buy or sell commands.
How to Draw Divergence Correctly
Choose a timeframe before looking for the signal.
Mark two meaningful price pivots of the same type: low-to-low for bullish divergence or high-to-high for bearish divergence.
Locate the RSI values at those same pivots.
Compare direction, not just absolute RSI values.
Ignore patterns that require forcing the line through unrelated swings.
Define the price level that would confirm your reversal thesis.
Define the price level that would invalidate the setup before entering.
The alignment step is critical. A common chart-reading error is connecting one price pivot to an RSI pivot that occurred several bars earlier or later. Small timing differences are normal, but the comparison should still refer to the same market swings.
A Simple RSI Divergence Trading Workflow
Stage
Question
Action
Context
Is price trending, ranging, or testing a major level?
Mark support, resistance, and recent swing structure.
Signal
Is there a valid regular divergence?
Compare two matching price and RSI pivots.
Confirmation
Has price structure changed?
Wait for a breakout, breakdown, or another defined trigger.
Risk
Where is the setup invalid?
Set an invalidation level before deciding position size.
Review
Did the pattern work for the reason expected?
Log the chart, setup type, timeframe, and outcome.
Regular vs. Hidden Divergence
Regular divergence is primarily used as a reversal warning. Hidden divergence is usually interpreted as a continuation pattern. In a bullish hidden divergence, price makes a higher low while the oscillator makes a lower low; in a bearish hidden divergence, price makes a lower high while the oscillator makes a higher high. Schwab’s educational material describes these hidden patterns as suggesting that the existing trend may continue.
Do not mix the two categories. If the goal is to catch a reversal, regular divergence is the relevant pattern. If the goal is to find continuation after a pullback, hidden divergence belongs in a different playbook.
Final Pre-Trade Checklist
Are the two price pivots obvious without zooming excessively?
Are the RSI pivots aligned with the same price swings?
Is it regular divergence, not hidden divergence?
Does the broader market structure support the reversal idea?
Has price confirmed the divergence with a trigger you defined in advance?
Do you know exactly where the setup is invalid?
Is the potential loss acceptable if the divergence fails?
Are you avoiding a decision based only on RSI crossing 30 or 70?
Bottom Line
RSI divergence is best used as a structured warning system. Bullish divergence tells you that a new price low is arriving with less downside momentum; bearish divergence tells you that a new price high is arriving with less upside momentum. Neither pattern guarantees a reversal.
The practical edge comes from combining three steps: identify a clean divergence, wait for price confirmation, and define invalidation before taking risk. That approach respects what RSI actually measures—momentum—while leaving the final decision to price action and risk management. Historical chart patterns and indicators cannot guarantee future results, so test any divergence method on the market and timeframe you intend to trade before relying on it with real capital.