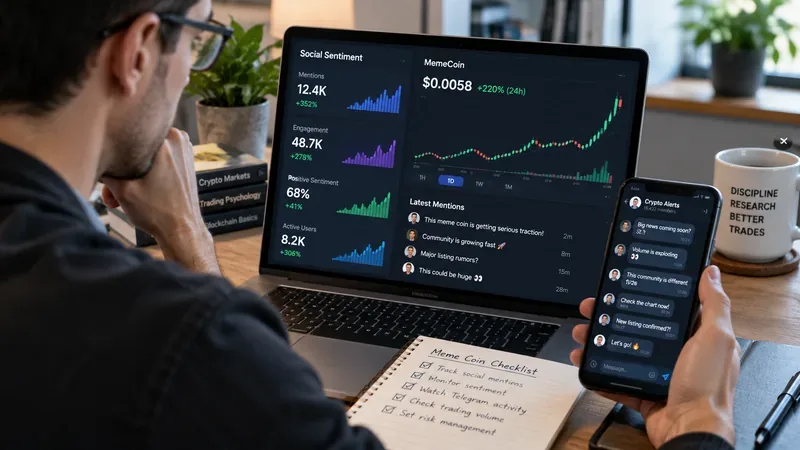
How to Analyze Trading Volume to Confirm a Crypto Pump
Learn how to compare crypto volume with its baseline, confirm price breakouts, spot fading momentum, and avoid mistaking a manipulated spike for strength.
Trading volume can help answer a practical question: is a sharp crypto price move attracting unusually heavy participation, or is price moving on relatively little activity? A pump accompanied by expanding volume is generally more meaningful than the same price jump on thin volume, but volume is not proof that the move is healthy, sustainable, or free from manipulation.
That distinction matters in crypto. The U.S. Commodity Futures Trading Commission warns that pump-and-dump schemes can target thinly traded or lesser-known tokens, and that organizers may create artificial demand before selling into the buying they helped trigger. Academic research published in the Journal of Financial and Quantitative Analysis likewise documents pump-and-dump episodes characterized by sharp increases in price, volume, and volatility followed by quick reversals. See the CFTC pump-and-dump advisory and the original research article from Cambridge University Press.
The goal, then, is not to ask whether volume “proves” a pump. It is to ask four questions in sequence: Is volume unusual? Is it expanding with price? Does participation persist? And does the move appear across more than one venue?
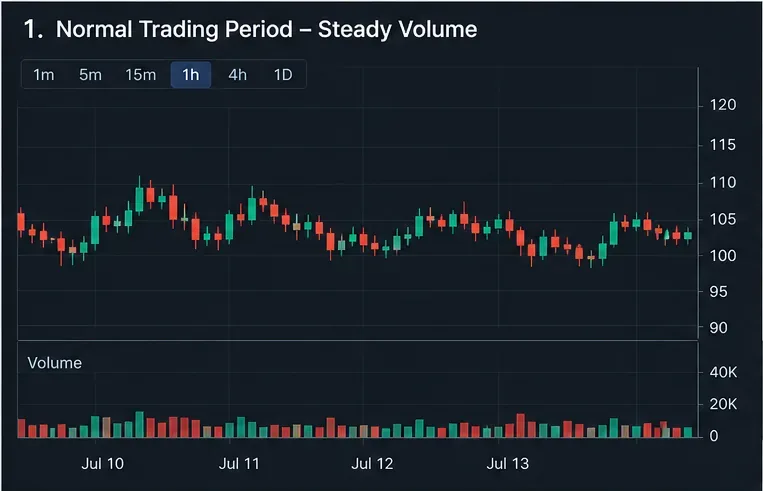
Start with a baseline before looking at the pump itself. A volume bar that looks large on screen may be ordinary for that token, exchange, or hour of the day. Compare the current bar with recent bars using the same trading pair and the same timeframe.
A simple relative-volume calculation is:
Relative volume = current bar volume ÷ typical volume for comparable recent bars
You can use an average, but a median is often useful when recent history already contains several extreme spikes. For example, if the current one-hour candle has 8 million units of volume while the median of the previous 20 one-hour candles is 2 million, relative volume is 4.0. That tells you activity is four times the recent median. It does not tell you why the activity occurred.
There is no universal research-backed rule that “2x volume confirms a pump” or “3x volume guarantees a breakout.” Thresholds such as 1.5x, 2x, or 3x are trader-defined heuristics. A better practice is to use the ratio to rank how exceptional the move is, then confirm it with price behavior and follow-through.
Data definitions also matter. Coinbase Exchange documentation describes candle data as grouped time buckets that include a volume field representing trading activity during each interval. TradingView notes that crypto volume tools may use base or quote volume depending on the market and data source. Keep comparisons internally consistent instead of mixing unlike measurements. See the Coinbase Exchange candle documentation and TradingView's volume-profile documentation.
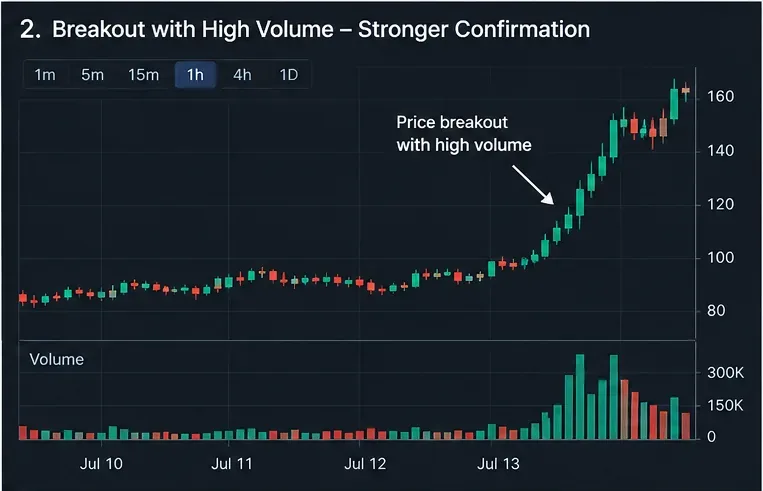
A stronger confirmation occurs when price and volume expand together. Suppose a token has traded between $0.92 and $1.00 for several hours. It then closes a one-hour candle at $1.09 while volume rises to four times its recent median. That is more informative than a brief wick to $1.09 that closes back inside the old range.
Look at the candle close, not only the highest trade. A breakout that closes above a prior resistance area while volume expands suggests that the market accepted higher prices during that interval. By contrast, a huge volume bar with a long upper wick and a weak close can mean heavy two-way trading or aggressive selling into buyers.
A useful comparison table is:
| Price behavior | Volume behavior | What it suggests |
|---|---|---|
| Breakout closes above resistance | Clearly above baseline | Stronger participation; investigate follow-through |
| Price spikes but closes back in range | Very high | Possible rejection or heavy distribution; do not treat volume alone as bullish |
| Price rises gradually | Flat or falling | Momentum may be narrowing |
| Price barely moves | Suddenly extreme | Large turnover without directional confirmation; wait for structure to resolve |
The first spike is only the beginning of the analysis. A move is more credible when subsequent candles continue to attract elevated activity and hold a meaningful portion of the price advance. If the first pump candle posts extreme volume but the next few candles show rapidly shrinking volume, repeated upper wicks, and loss of the breakout level, confirmation is weakening.
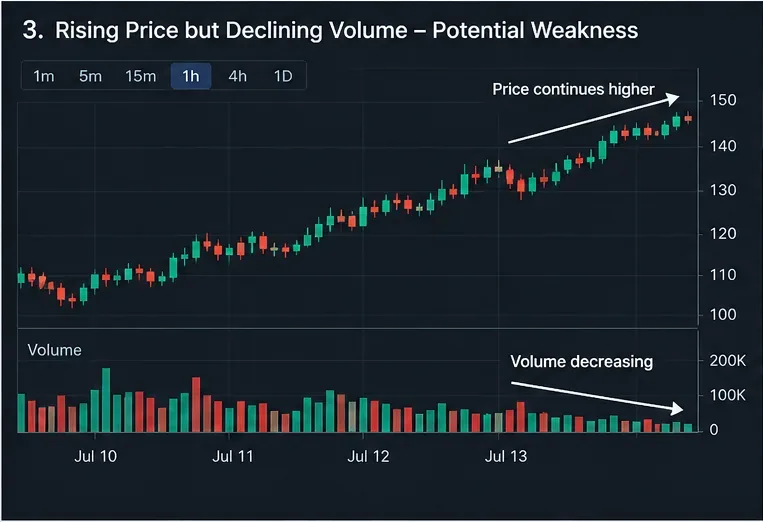
Watch for price-volume divergence. If price keeps making higher highs while volume steadily declines, fewer traded units are supporting each new high. That does not guarantee a reversal; strong trends can continue while volume cools. It does mean the evidence is weaker than it was during the initial breakout.
Volume is reactive evidence. TradingView's documentation explicitly describes volume profile as showing where trading activity occurred rather than predicting what comes next. Use it to evaluate the quality of the move you can observe, not as a promise of the next candle.
Crypto trades on fragmented venues. A sudden move on one exchange can be less convincing if other large venues for the same asset show little comparable activity. If practical, compare the same pair or economically equivalent pairs across multiple reputable exchanges over the same interval.
You are not looking for identical numbers. Exchanges have different customers, order books, pair conventions, and reported volume units. Instead, look for directional agreement: does price rise at roughly the same time, and does trading activity become unusually heavy on more than one venue?
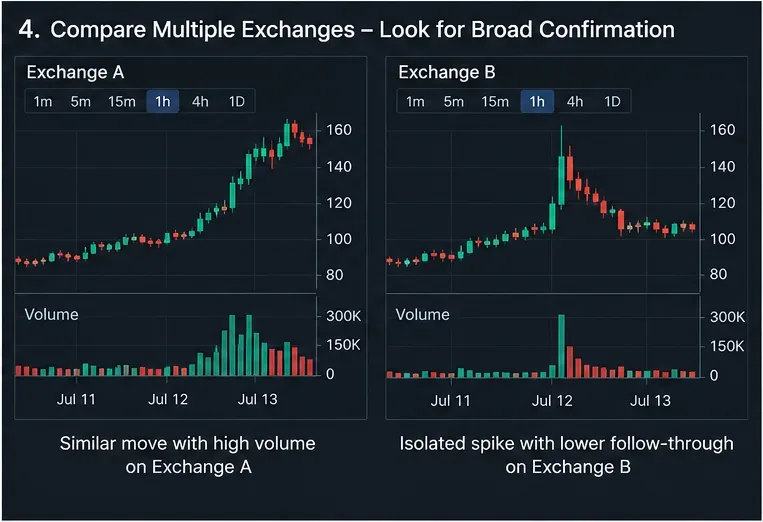
Imagine Token X normally trades about $3 million per hour. During one hour, volume jumps to $12 million.
Scenario A: Price breaks from $4.80 to $5.30, closes at $5.26, the next two hourly candles hold above $5.10, and other major venues show similar activity. The 4x volume spike supports the view that the breakout attracted broad participation. It still does not guarantee continuation.
Scenario B: Price jumps from $4.80 to $5.60 but closes at $4.95, the next candle trades below $4.80, and most of the extreme volume appears on only one venue. The same 4x volume ratio now looks more like a failed spike or distribution event than confirmation of durable momentum.
The lesson is that volume must be interpreted in context. A number without market structure is incomplete evidence.
Be especially cautious when a move starts after an unsolicited Telegram, WhatsApp, Discord, or social-media call to buy immediately; when the token normally has very low liquidity; or when price becomes nearly vertical within minutes. The CFTC specifically warns that coordinated pump-and-dump groups can use messaging channels and false urgency, and that some schemes complete the buy-and-sell cycle in only minutes. Its more recent guidance also warns users about crypto scams promoted through messaging apps. See the CFTC messaging-app advisory.
High volume in that setting may confirm that many trades are happening, but it cannot distinguish genuine demand from coordinated manipulation by itself. Volume is therefore best treated as a confirmation tool for participation, not a detector of legitimacy.
To analyze trading volume during a crypto pump, compare current activity with a recent baseline, require price and volume to confirm each other, watch whether the move holds after the first surge, and check whether the behavior appears across more than one venue. The strongest evidence is not simply “big volume.” It is unusually high volume combined with a convincing close, sustained participation, and broad market agreement.
Even then, the conclusion should remain probabilistic. Pumps can reverse abruptly, reported data can differ by venue, and manipulated markets can show enormous real trading volume. Define your risk before entering rather than assuming a high-volume breakout has removed the possibility of loss.
Source check: Official documentation and original research referenced above were reviewed on September 16, 2026.
Learn how to compare crypto volume with its baseline, confirm price breakouts, spot fading momentum, and avoid mistaking a manipulated spike for strength.
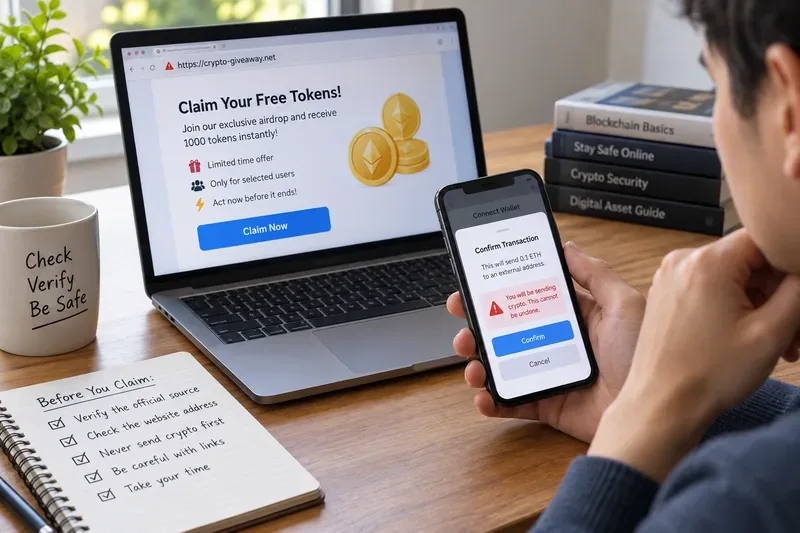
Learn how to spot fake crypto airdrops and giveaway scams, verify claims safely, understand wallet approval risks, and respond quickly if you already interacted.
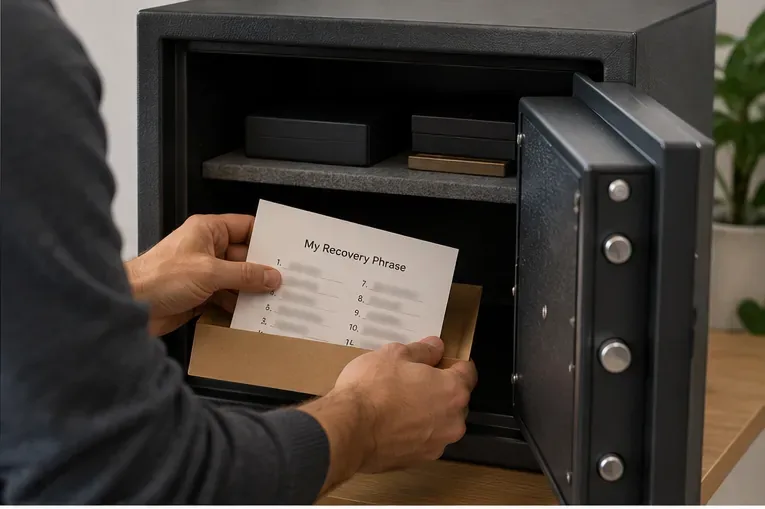
Protect your crypto seed phrase with an offline backup, secure physical storage, redundancy, phishing defenses, and a clear recovery plan.
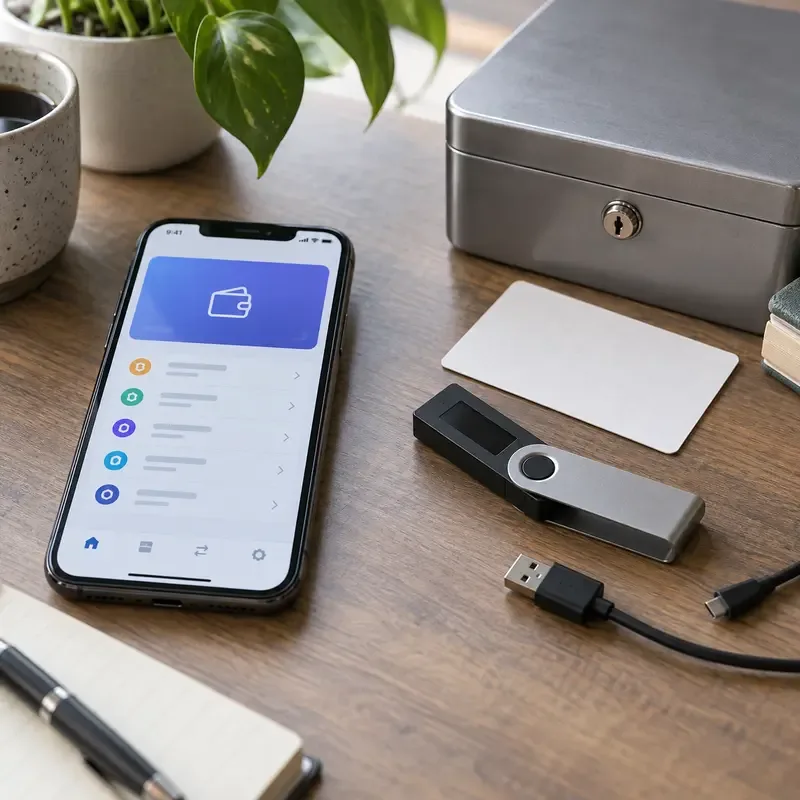
Compare hot and cold crypto wallets by convenience, online exposure, recovery risk, and real-world use. Learn which setup fits trading, spending, and long-term storage.
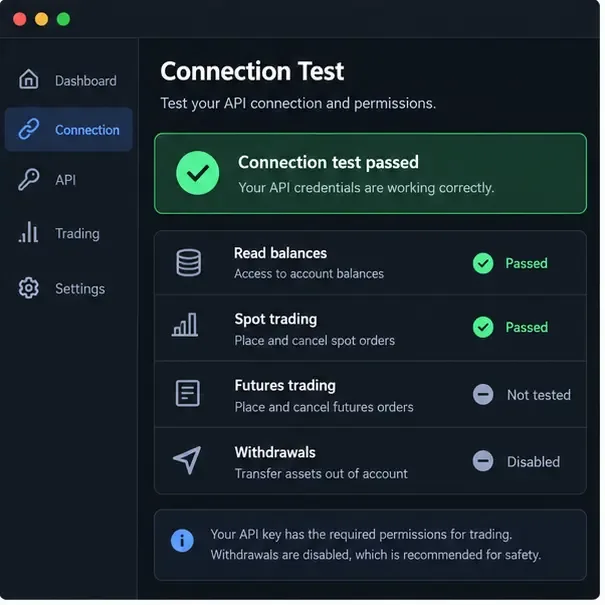
Fix crypto trading bot API key connection errors with a practical checklist for permissions, IP allowlists, signatures, timestamps, endpoints, rate limits, and secure re-testing on Binance and OKX.
Learn a practical breakout workflow using crypto screeners, liquidity and on-chain scanners, chart confirmation, and risk checks, with a clearly fictional example.
Learn how spot grid bots work, then set up and manage one on Binance or OKX with beginner-friendly parameters, risk checks, and exit steps.
Compare five free crypto token scanners for honeypots, scam signals, smart-contract vulnerabilities, holder risks, and token security before you trade.
Learn how to spot crypto rug-pull warning signs before buying: hype, team transparency, holder concentration, admin powers, liquidity, sell restrictions, and wallet approvals.
Learn how X (Twitter) and Telegram can amplify meme coin momentum, which social signals matter, how to spot coordinated hype, and how to avoid pump-and-dump traps.