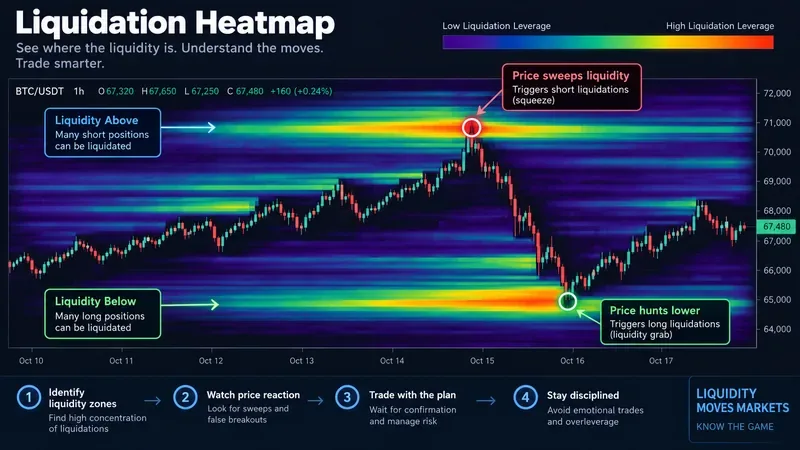
A crypto chart reaches a major daily or weekly resistance level. Price briefly trades above it, social feeds call a breakout, and the next candle reverses hard. Should you buy the breakout, wait for a retest, or treat the move as a rejection?
The useful answer is not “always wait for confirmation” or “always buy the first break.” A high-timeframe setup is a decision process. You first define the level and the timeframe that controls the idea, then decide what evidence would qualify as acceptance above the level versus rejection from it. Only after that do you plan an entry, invalidation, and position size.
What Counts as a High-Timeframe Breakout?
For this guide, “high timeframe” means charts such as the 4-hour, daily, and weekly chart, with the daily and weekly especially useful for defining major market structure. These are trading conventions rather than protocol-defined categories, so there is no universal rule saying that a daily close is inherently more predictive than a 4-hour close.
A breakout occurs when price moves through a previously important support, resistance, range boundary, or structural swing. The key question is whether the market begins accepting prices beyond that boundary. A wick through resistance followed by a close back inside the range is materially different from a daily close above resistance followed by continued trading above it.
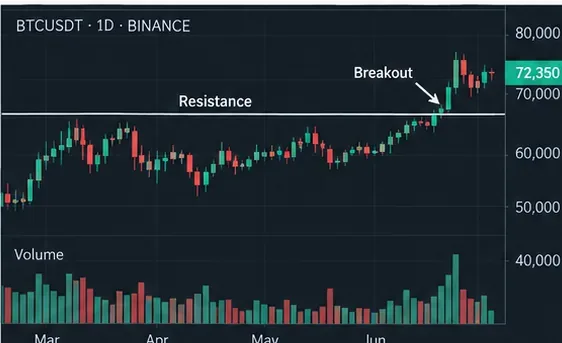
Caption: A high-timeframe breakout setup begins with a clearly defined resistance level and evidence that price is trading beyond it, rather than merely touching it intraday.
Should You Trade the Wick or Wait for the Candle Close?
For a strategy based on daily or weekly structure, waiting for the relevant candle to close is usually the cleaner way to test your own breakout definition. It prevents a temporary intraday move from being silently reclassified as a confirmed breakout.
That does not make a close a guarantee. Price can close above resistance and fail on the next candle. The benefit is consistency: if your rule says “daily close above resistance,” you can test that rule historically and apply it without changing the definition mid-trade.
Before entering, write down the exact condition. For example: “The daily candle must close above the resistance zone, not merely wick through it.” Avoid vague rules such as “price looks strong.”
When Is a Move Better Treated as a Rejection?
A rejection is a failed attempt to sustain prices through a level. Common observations include a long wick beyond the level, a close back inside the prior range, a failed follow-through candle, or a breakout that quickly loses the former boundary.
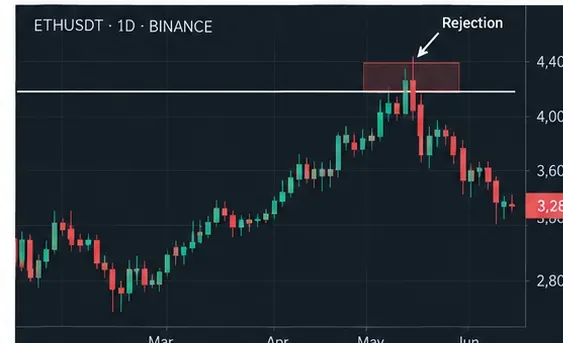
Caption: A rejection setup forms when price tests a major resistance area but fails to remain above it and returns toward the prior trading range.
Do not assume every long wick should be shorted. Context matters. A rejection against a strong weekly uptrend can simply be a pause. Conversely, a failed breakout after repeated tests of resistance can still reverse again. The chart pattern identifies a setup; it does not establish the future outcome.
Is a Retest Required After a Breakout?
No. Some breakouts never return to the old boundary, while others retest it precisely and others fall straight back through it. Requiring a retest can reduce the number of entries and may give you a clearer invalidation point, but it also means missing moves that continue immediately.
This creates a practical trade-off:
| Approach | Potential advantage | Main drawback |
|---|
| Enter on high-timeframe close | Participates sooner if momentum continues | Greater exposure to failed breakouts |
| Wait for retest | Can provide a more defined level for invalidation | Price may never retest |
| Enter after retest confirmation | Adds evidence that the old level is being defended | Later entry can reduce reward relative to risk |
Choose one approach before the setup occurs. Switching from “close entry” to “retest entry” only because price moved without you encourages inconsistent decision-making.
How Should You Plan Entry, Stop, and Target?
Start with invalidation, not the profit target. Ask: what price behavior would show that the reason for this trade is no longer valid?
For a breakout long, invalidation might be a decisive move back below the reclaimed resistance zone. For a rejection short, it might be sustained acceptance above the rejected resistance. The exact buffer depends on the asset's volatility and your tested method; there is no universally correct percentage.
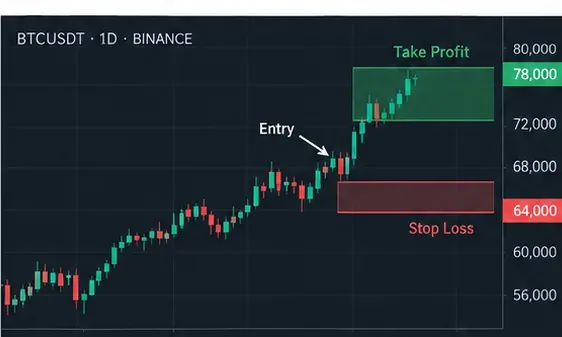
Caption: Define the entry, invalidation area, and target before placing a breakout trade so that the amount at risk can be calculated in advance.
Order mechanics matter too. According to the current Coinbase Advanced order-type documentation, a market order executes at the best available prices, while limit and stop-limit orders impose price conditions. Coinbase also explicitly notes that stop-based orders may fail to execute as expected during extreme volatility. That is an important distinction: a stop price is not a promise that every position will be filled at exactly that price.
A simple risk calculation
Suppose a hypothetical account is $20,000 and the trader's predefined maximum loss for one setup is 0.5%, or $100. If the planned entry and invalidation are $2,000 apart on BTC, the position size should be based on that $100 loss limit and the $2,000 distance—not on how confident the trader feels.
This example is purely illustrative. Fees, slippage, gaps, funding costs, contract specifications, and execution can make realized loss different from the planned amount.
How Do Weekly and Daily Charts Work Together?
Use the higher chart to establish context and the lower of your chosen high timeframes to define execution. For example, a weekly chart may show a broad uptrend and a major resistance zone. The daily chart can then show whether price closes above that zone, retests it, and holds.
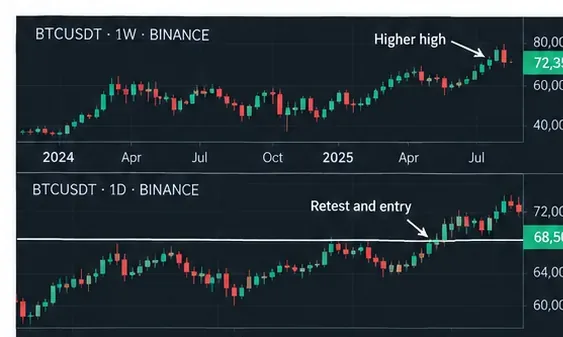
Caption: Multi-timeframe analysis can use the weekly chart for broad structure and the daily chart for a more precise breakout, retest, or rejection decision.
This does not mean lower timeframes must agree perfectly. A daily breakout can contain many bearish hourly candles. The important point is to avoid letting a five-minute fluctuation invalidate a thesis that was explicitly built around a daily close unless your trading plan says it should.
Does Volume Confirm a Breakout?
Volume can add context, but it should not be treated as a binary guarantee. Increased trading activity during a break can indicate stronger participation. However, crypto trades across multiple centralized and decentralized venues, so one exchange's volume is not the entire market.
Compare volume consistently on the same venue and pair used in your historical testing. If you use a volume threshold, define it objectively—for example relative to a moving average or recent distribution—and test it. Do not retroactively call volume “high enough” only after seeing whether the trade worked.
How Do You Trade a Rejection Without Guessing the Top?
Let the rejection occur first. A trader who sells simply because price reached resistance is predicting that resistance will hold. A trader who waits for predefined rejection evidence is reacting to observed behavior.
A structured rejection plan might require: a test above or into the resistance zone, a daily close back below the boundary, and an invalidation level above the rejection high. Another method might wait for the next candle to break the rejection candle's low. Neither is inherently superior; each needs testing on the assets and timeframes you trade.
The same logic works at support in reverse. A downside break that immediately recovers above support can become a failed-breakdown or bullish rejection setup.
What Makes a Breakout Setup Too Risky to Trade?
Skip a setup when you cannot define the invalidation without taking more risk than your plan permits. Other warning signs include extremely thin liquidity, unusually wide spreads, a breakout candle so extended that a logical stop creates poor reward-to-risk, or an imminent event capable of sharply changing volatility.
Leverage deserves particular caution. The U.S. Commodity Futures Trading Commission explains in its virtual currency trading risk advisory that crypto markets can be highly volatile and that leverage can amplify gains and losses. A technically reasonable setup can therefore become an unacceptable account-level risk when position size or leverage is excessive.
Also be skeptical of “guaranteed breakout” calls circulating online. The CFTC's pump-and-dump customer advisory specifically warns against buying digital assets based solely on social-media tips or sudden price spikes.
A Practical Breakout-vs.-Rejection Decision Process
- Mark the high-timeframe zone. Use prior swing highs/lows, range boundaries, or repeatedly tested support/resistance.
- Define breakout and rejection before price arrives. Specify whether your rule depends on a wick, close, retest, or follow-through.
- Wait for the relevant candle. If the setup is daily, evaluate the daily candle rather than reacting to every intraday move.
- Classify what happened. Did price gain acceptance beyond the level, reject it, or remain ambiguous?
- Define invalidation. Identify the price action that proves the setup wrong.
- Calculate position size. Work backward from maximum acceptable account loss.
- Choose execution deliberately. Understand the behavior and limitations of market, limit, and stop orders on your venue.
- Record the result. Save the chart and whether the setup followed your rules, regardless of profit or loss.
How Can You Tell Whether Your Method Actually Works?
Do not judge the method from three memorable trades. Build a journal of comparable setups. Record the asset, timeframe, level type, breakout or rejection definition, entry method, stop distance, target logic, fees, slippage, maximum favorable excursion, maximum adverse excursion, and final result.
Then separate the samples. Compare daily-close breakout entries with retest entries rather than mixing them. Compare trend-aligned rejections with countertrend rejections. Calculate win rate, average win, average loss, expectancy, drawdown, and the number of observations.
Most importantly, look for rule drift. If losing trades are frequently labeled “exceptions” while winning trades are counted as valid setups, the test is not measuring a reproducible strategy.
Final Self-Check Before You Place the Trade
- Can I state the exact high-timeframe level and why it matters?
- What specifically distinguishes a breakout from a rejection in my rules?
- Has the candle required by my method actually closed?
- Am I entering immediately, on a retest, or after follow-through—and was that decided beforehand?
- Where is the setup invalidated?
- How much of my account can be lost if the stop does not fill perfectly?
- Does the potential target justify the risk under my tested method?
- Am I reacting to chart evidence rather than a social-media call or sudden price spike?
- Will I record this trade even if it loses?
If you cannot answer those questions before entry, the setup is not yet fully defined. The central difference between trading high-timeframe breakouts and rejections is not predicting which side will win. It is deciding in advance what evidence you require, how you will respond to that evidence, and how much you are willing to lose when the market proves the idea wrong.
Risk note: This material is educational and does not constitute individualized financial advice. Crypto assets can move rapidly, and leveraged trading can produce losses greater than expected. No breakout, rejection, volume pattern, candle close, or retest guarantees a profitable outcome.