Home
» News
»
Master the Liquidation Heatmap: How Liquidity Traps Catch Retail Traders
Master the Liquidation Heatmap: How Liquidity Traps Catch Retail Traders
Updated September 15, 2026: Liquidation heatmaps are useful, but they are often explained with more certainty than the underlying data supports. A heatmap can highlight estimated areas where leveraged positions may become vulnerable. It cannot prove that a market maker is deliberately targeting a specific retail trader, and it does not provide a complete map of every position across every exchange.
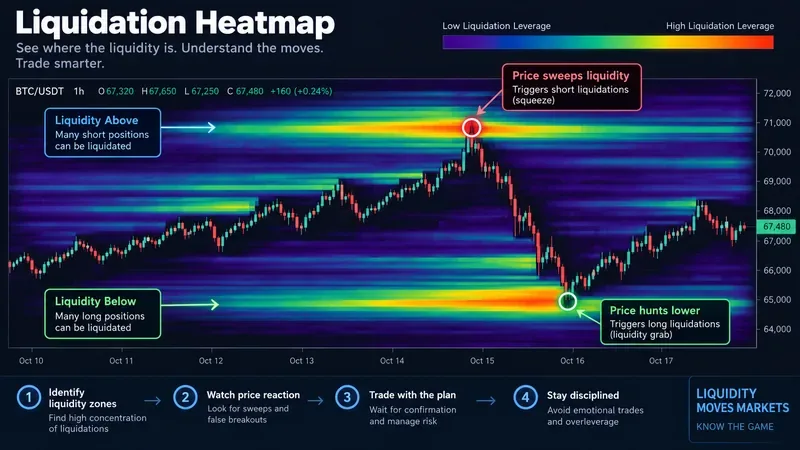
A practical liquidation heatmap example: brighter horizontal zones represent estimated concentrations of liquidation risk, while price reactions still require confirmation from actual market behavior.
Liquidation heatmap: quick reference
What you see
What it may suggest
What it does not prove
Bright band above price
Estimated short-liquidation concentration
Price must rally there
Bright band below price
Estimated long-liquidation concentration
Price must fall there
Zone becomes brighter
Estimated liquidation exposure has increased
Exact open positions are known
Price enters a bright zone
Forced closing may add to order flow
A reversal will occur
Fast move through several zones
A liquidation cascade may be contributing
Market manipulation caused the move
What is a liquidation heatmap actually showing?
A liquidation heatmap is a visualization of estimated price regions where leveraged derivatives positions could face forced liquidation. Different providers use different models, exchange data, leverage assumptions, and aggregation methods, so two heatmaps can disagree.
The underlying liquidation mechanism, however, is real and documented by derivatives venues. Binance Futures states that liquidation is triggered when a position's Mark Price reaches its liquidation price and that margin requirements depend on factors including exposure and maintenance margin. Its documentation was updated January 4, 2026. See the Binance Futures liquidation protocol.
Bybit likewise states that isolated-margin liquidation occurs when Mark Price reaches the position's liquidation price, while cross and portfolio margin liquidation depends on account maintenance margin ratio. In cross margin, the displayed liquidation price can change as account equity and margin usage change. See the Bybit order execution and liquidation FAQ.
That distinction matters: a third-party heatmap generally cannot know every trader's collateral, cross-margin exposure, position changes, or risk settings. Treat its levels as estimates, not exchange-confirmed liquidation orders waiting at exact prices.
Why do traders say price is “hunting liquidity”?
Markets need counterparties. Areas around obvious highs, lows, breakout points, stop clusters, and leveraged liquidation levels can generate unusually large order flow when reached. If price rises into an area containing vulnerable shorts, forced short closures require buying. If price falls into leveraged longs, forced closures can add selling pressure.
This creates a feedback mechanism. A move reaches a vulnerable area, liquidations add market orders, those orders can push price farther, and the additional movement can trigger more liquidations. In extreme conditions, this can resemble a cascade.
But the phrase “market makers trap retail traders” compresses several different phenomena into one story. Market makers generally quote bids and offers and manage inventory risk. Other participants include directional funds, arbitrageurs, hedgers, high-frequency firms, and retail traders. A move toward liquidity can emerge from normal order-book dynamics without a coordinated actor choosing to “hunt” anyone.
Manipulation can occur in crypto markets, but it should not be inferred solely from a heatmap reaction. The CFTC warns that virtual-currency markets carry manipulation and volatility risks while also emphasizing that leveraged futures amplify losses. See the CFTC advisory on virtual-currency trading risk.
Mark Price versus Last Price: the detail that prevents bad heatmap trades
One of the most practical mistakes is watching only the candlestick price displayed by default. On major perpetual-futures venues, liquidation may be based on Mark Price rather than the most recent trade.
Binance says its Mark Price combines funding information with price data from multiple spot exchanges and uses it for liquidation and unrealized P&L. Bybit similarly explains that Mark Price is derived from a global spot index and funding basis and is used to trigger liquidation. See the Bybit futures guide.
This explains why a trader may believe “the chart never touched my liquidation price.” The visible chart may have been showing Last Traded Price while the exchange's Mark Price reached the liquidation threshold first.
How to read a liquidation heatmap in four passes
1. Locate the largest nearby clusters
Start above and below current price. Ignore the temptation to predict direction immediately. Identify which estimated liquidation zones are both large and close enough to matter on your trading horizon.
A bright cluster far away may be irrelevant to a short-duration trade. A smaller cluster immediately outside a well-defined range may matter sooner.
2. Compare the heatmap with market structure
Overlay the conceptual zones with ordinary price information: recent swing highs and lows, consolidation boundaries, prior breakout levels, and the prevailing trend. A liquidation cluster that overlaps an obvious structural level is more informative than a colorful band in isolation.
For example, suppose BTC is consolidating below a recent swing high and a large estimated short-liquidation cluster sits just above it. That identifies a region worth monitoring. It is not an instruction to buy immediately.
3. Wait for price behavior at the zone
Once price reaches the region, ask what actually happens. Does price accelerate through it? Does it briefly sweep the level and return? Does the breakout hold on a close? Does price retest the area successfully?
This separates a map from a trigger. The heatmap tells you where a reaction might become important; price behavior tells you whether your setup is occurring.
4. Define invalidation before entering
A heatmap trade still needs a point at which the thesis is wrong. If you expect a liquidity sweep and reversal, define how far price can hold beyond the zone before that idea is invalid. If you expect continuation after a liquidation cascade, define what failure to hold the breakout means.
Without invalidation, “price is hunting liquidity” can become an excuse to hold a losing position indefinitely.
How the classic retail “trap” can form
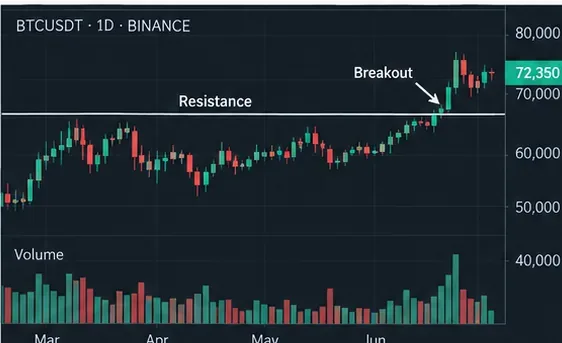
Consider a simplified scenario. BTC trades in a range. The upper boundary has been rejected several times, so traders begin shorting near resistance. Some use high leverage. Their estimated liquidation levels accumulate above the range.
Price then breaks above resistance. Shorts close voluntarily, stop orders trigger, breakout traders buy, and some leveraged shorts are liquidated. All of those flows can add buying pressure. Price accelerates upward.
Two very different outcomes are now possible. In a genuine breakout, demand remains strong and price holds above the former range. In a liquidity sweep, the burst of forced buying exhausts, price falls back below the boundary, and late breakout buyers are trapped.
The heatmap cannot reliably tell you which outcome will occur beforehand. The useful edge is recognizing the mechanism and waiting for confirmation rather than assuming every bright zone will reverse price.
Continuation or liquidity sweep? Use this comparison
Observation
More consistent with continuation
More consistent with a sweep
Move into zone
Price expands and holds
Sharp penetration followed by rapid rejection
Former boundary
Becomes support after breakout
Price closes back inside prior range
Follow-through
New highs/lows continue
Momentum quickly disappears
Entry style
Breakout/retest
Reclaim or failed-breakout confirmation
Main risk
Buying the final stage of a cascade
Fading a genuine trend breakout
What should you combine with a heatmap?
Price structure: This remains the foundation. A heatmap without highs, lows, ranges, and trend context is easy to overinterpret.
Open interest: Changes in outstanding derivatives exposure can help distinguish an environment where leverage is building from one where positions are being closed. It still does not reveal every trader's direction or liquidation price.
Funding: Extreme funding can indicate an imbalanced perpetual-futures market, but it is not a standalone reversal signal. Funding can remain elevated while a trend persists.
Spot versus perpetual behavior: If a move is driven primarily by leveraged derivatives while spot demand is weak, the move may have different characteristics from broad buying across markets. This requires reliable venue-specific data and should not be inferred from a heatmap alone.
Mark Price: If you personally trade leveraged perpetuals, monitor the price that your venue actually uses for liquidation. This is a risk-control requirement, not merely an analytical indicator.
Common liquidation-heatmap mistakes
Treating bright zones as magnets. Price is not obligated to visit the largest cluster.
Assuming every sweep is manipulation. Forced orders, stops, hedging, arbitrage, and ordinary supply and demand can create similar price behavior.
Entering before confirmation. Knowing where liquidations may occur does not reveal when price will move there or whether it will reverse.
Ignoring the heatmap model. Estimated levels depend on the provider's methodology and data coverage.
Using excessive leverage because a zone “looks obvious.” Leverage makes a small analytical error much more expensive.
Watching Last Price while liquidation uses Mark Price. Check the rules of your specific exchange and contract.
Risk checklist before a heatmap-based trade
Do I know whether the heatmap uses actual reported liquidations, modeled future liquidations, or both?
Does the zone align with a meaningful market-structure level?
Am I trading a reaction, breakout, or reversal—and what confirms it?
Where is my invalidation point?
What is my maximum dollar loss if the setup fails?
Which price triggers liquidation on my venue: Mark Price, Last Price, or another reference?
Could cross-margin exposure change my liquidation risk?
Am I assuming malicious intent when ordinary market mechanics explain the move?
The most useful way to “master” a liquidation heatmap
Do not use the heatmap as a fortune-telling tool. Use it as a map of possible leveraged stress. It can help identify areas where forced order flow may become important, explain why price can accelerate after crossing certain levels, and improve planning around crowded positions.
The strongest workflow is simple: identify an estimated liquidation cluster, place it in the context of market structure, wait for actual price behavior, and size the trade so being wrong is manageable.
Most importantly, do not turn “market makers are trapping retail” into an unfalsifiable trading thesis. There are genuine incentives to seek liquidity and there are genuine manipulation risks in financial markets, but a liquidation heatmap by itself does not identify the actor behind a move. Trading the observable mechanism is more useful than guessing the motive.
Coinbase's derivatives documentation gives a useful reminder of the stakes: leveraged positions may be liquidated when collateral becomes insufficient, liquidation can produce less-favorable pricing than self-executed trades, and leverage amplifies both profits and losses. See the Coinbase derivatives liquidation guidance.
Risk note: This reference is educational, not individualized financial advice. Crypto derivatives are high-risk products, heatmaps contain estimates, and liquidation mechanics vary by venue, contract, margin mode, and account conditions.