Home
» Knowledge
»
Maker and Taker Fees: Calculate the Break-Even Move After Entry and Exit Costs
Maker and Taker Fees: Calculate the Break-Even Move After Entry and Exit Costs
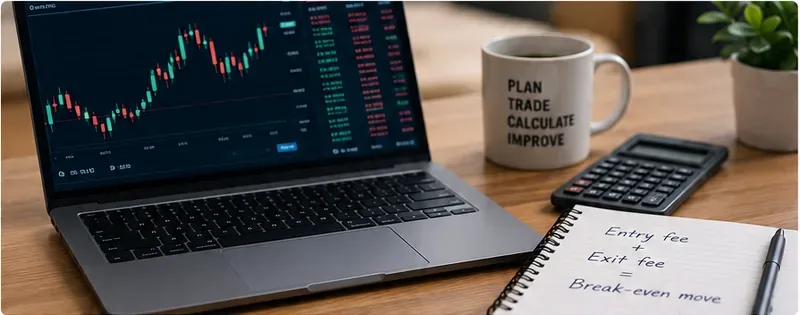
A trade can move in the direction you expected and still lose money. The reason is simple: your chart shows price movement, while your account records price movement after trading costs. If you pay a fee when you enter and another fee when you exit, the market has to move far enough to recover both before the trade is truly at break-even.
This guide shows how to calculate that threshold for a straightforward long spot trade. You will learn what “maker” and “taker” mean, how to identify the fee rates that actually apply to your order, how to calculate entry and exit costs, and how to turn those costs into an exact break-even price. The worked percentages below are hypothetical so that the method stays useful across exchanges.
What a beginner needs to know first
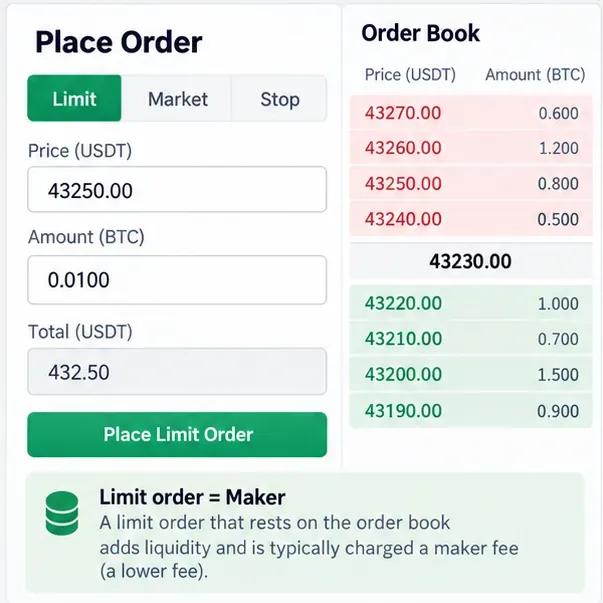
A maker order is an order that adds liquidity to an order book by resting there until another participant trades against it. A taker order removes liquidity by matching immediately with an existing order. A market order is normally a taker order. A limit order is not automatically a maker order: if your limit price crosses the book and fills immediately, all or part of it can be charged as taker liquidity.
Coinbase Advanced explains this distinction directly: an immediately filled order is treated as taker liquidity, while an order that rests on the book can receive maker treatment; a partially matched order can even be split between taker and maker fees. Its fee tier is determined at the time of the order and can update with trading volume. See the official Coinbase Advanced fee documentation.
Kraken likewise uses maker/taker pricing and states that fees depend on factors such as 30-day volume, trading pair, and whether an execution is maker or taker. Its support page was updated September 5, 2026. Because exchanges can change fee schedules, always use the rate shown for your account, product, pair, and order at the time you trade. See Kraken’s official explanation of trading fees and current fee schedule.
A limit order can be maker liquidity only when it rests on the order book; an immediately executed portion can be taker liquidity.
Step 1: Write down the fee rate for each side of the trade
Do not begin with a rule such as “maker is 0.02%” or “taker is 0.10%.” Those numbers are not universal. Begin with the actual rates shown by your venue. You need two inputs:
Entry fee rate, fentry: the percentage charged on the opening execution.
Exit fee rate, fexit: the percentage you expect to pay when closing.
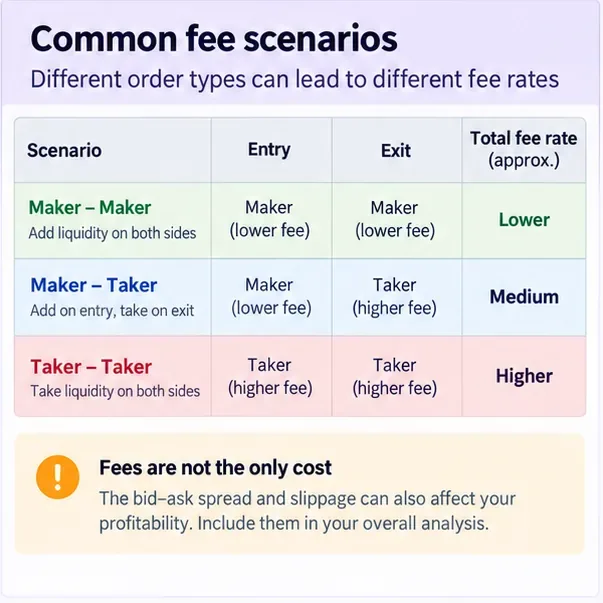
If you are unsure how the exit will execute, calculate more than one scenario. For example, compare maker-entry/maker-exit, maker-entry/taker-exit, and taker-entry/taker-exit. That gives you a realistic range instead of a single optimistic number.
Step 2: Calculate the entry notional and entry fee
Notional value is the cash value of the position before fees. For a spot purchase, it is:
Entry notional = entry price × quantity
Then calculate the fee:
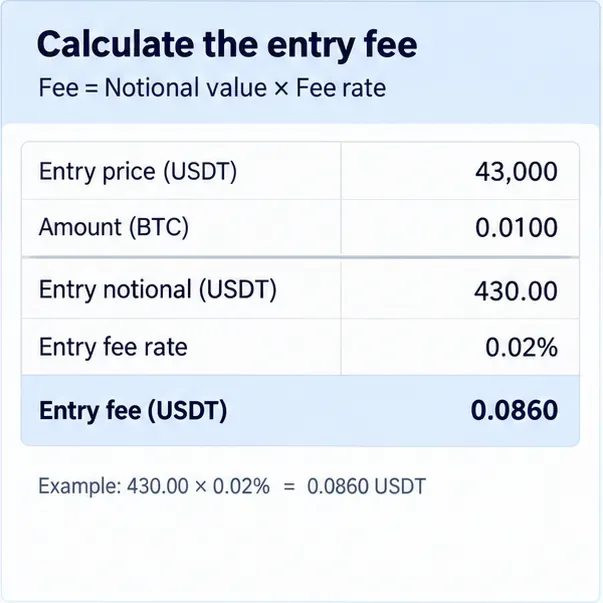
Entry fee = entry notional × entry fee rate
Suppose you buy 0.0100 BTC at an illustrative price of 43,000 USDT and your entry fee is 0.02%.
Entry notional = 43,000 × 0.0100 = 430.00 USDT
Entry fee = 430.00 × 0.0002 = 0.0860 USDT
Total entry cash cost = 430.0860 USDT
Multiply notional value by the fee rate. In this hypothetical example, a 430 USDT entry at 0.02% costs 0.0860 USDT.
Step 3: Use the exact break-even formula
A common shortcut is to add the entry and exit percentages. That is a useful approximation when fees are small, but it is not mathematically exact because the exit fee is charged on the exit value, not the original entry value.
For a long spot trade where both fees are charged against quote-currency notional and you sell the same quantity you bought, break-even occurs when net exit proceeds equal total entry cost:
The simple “fees added together” estimate would be 0.12%. That is close here, but the exact formula is preferable for a trading journal, spreadsheet, backtest, or any strategy where small cost differences matter.
Keep fee assumptions beside the trade plan so the target can be evaluated against the full round-trip cost, not price movement alone.
Step 4: Verify the result in cash terms
A second calculation is an excellent error check. At the exact break-even price of about 43,051.65 USDT, the 0.0100 BTC position is worth about 430.5165 USDT before the exit fee. A 0.10% exit fee is about 0.4305 USDT, leaving approximately 430.0860 USDT after the exit fee. That matches the 430.0860 USDT total entry cost.
If those two numbers do not match, recheck your percentage conversion, fee basis, quantity, or rounding. Remember that 0.10% is 0.001 in decimal form, not 0.10.
Compare maker and taker combinations before you place the trade
Execution style changes the threshold because entry and exit can have different rates. The table below uses hypothetical fees purely to show the calculation method.
Scenario
Entry fee
Exit fee
Exact break-even move
Maker entry / maker exit
0.02%
0.02%
about 0.04001%
Maker entry / taker exit
0.02%
0.10%
about 0.12012%
Taker entry / taker exit
0.10%
0.10%
about 0.20020%
The practical lesson is not that one order type is always superior. A maker order may reduce explicit fees, but waiting for a fill creates execution risk: the market may move away and never fill you. A taker order provides immediacy, but you generally accept the displayed liquidity and may pay a different fee. In fast markets, the price you actually receive can matter more than a small difference in the posted fee rate.
Model more than one execution path. The cheapest posted fee is not the only trading cost; spread and slippage can change the realized result.
Costs that the fee formula does not capture
The formula above isolates exchange transaction fees. Your true economic break-even can be farther away because of other costs. The bid-ask spread is the gap between the best available bid and ask. Slippage is the difference between the price you expected and the average price at which the order actually filled. Investor.gov notes that execution can involve trade-offs between price, speed, and the possibility of price improvement; its overview of order execution is a useful primary-source reference for those concepts.
Depending on the product, you may also need to account for funding payments, margin interest, borrow fees, conversion fees, rebates, taxes, or withdrawal/network costs. Futures and margin trades therefore need a broader cost model than the simple spot example used here.
One important fee-currency caveat
The exact formula above assumes the exchange assesses entry and exit fees against the quote-currency value and that the quantity sold is the same quantity bought. Some venues or account settings may deduct a fee in the asset being bought, in a separate platform token, or through another mechanism. If the fee reduces the amount of base asset you receive, the algebra changes because your exit quantity is smaller.
Before automating the calculation, inspect an actual trade confirmation and answer three questions: What currency was the fee charged in? What notional value was the percentage applied to? Did the fee reduce the quantity available to sell? Use that observed accounting treatment in your journal.
Common beginner mistakes to avoid
Assuming every limit order is maker. A marketable limit order can execute immediately and be taker liquidity.
Using one fee rate for both sides. Entry and exit can have different liquidity classifications.
Adding percentages and calling the result exact. The sum is an approximation; use the ratio formula for precision.
Forgetting that fee tiers change. Volume tiers, pair-specific schedules, promotions, and rebates can alter the rate.
Ignoring partial fills. Different portions of one order can receive different liquidity treatment.
Ignoring spread and slippage. Fee-only break-even is not necessarily your true trading break-even.
Mixing percent and decimal formats. Convert 0.10% to 0.001 before multiplying.
A quick pre-trade checklist
Confirm the current fee schedule for the exact venue, product, and trading pair.
Decide whether your entry is expected to be maker, taker, or potentially mixed.
Choose a realistic exit assumption; calculate both maker and taker exits if uncertain.
Verify the result by checking that net exit proceeds equal total entry cost.
Add spread, expected slippage, and any product-specific costs before judging whether the trade’s target is large enough.
How to know your calculation is working
Your calculation passes a simple self-check when the net proceeds at the computed exit price exactly offset the entry notional plus the entry fee, allowing for the venue’s rounding rules. Keep the raw fee rates, execution type, fee currency, and actual fills in your trading journal. After the trade closes, compare the predicted cost with the realized cost. If the difference is consistently large, the issue is probably not the break-even formula itself; it is more likely that your assumptions about maker/taker status, slippage, spread, fee currency, or tier were incomplete.
That final comparison is what turns a fee estimate into a useful trading process. The goal is not merely to know that fees exist, but to know the minimum move your strategy needs before it has earned anything after the costs of getting in and out.