Home
» Knowledge
»
VWAP vs. Anchored VWAP: When Each Benchmark Answers a Different Question
VWAP vs. Anchored VWAP: When Each Benchmark Answers a Different Question
VWAP and anchored VWAP use the same basic idea—weighting price by volume—but they do not answer the same question. Session VWAP is usually a benchmark for a defined trading period, most often the current session. Anchored VWAP keeps the same volume-weighted logic but starts from a point you choose, such as an earnings release, a major gap, a swing high or low, or another event you want to study.
That distinction matters because a benchmark is only useful when its starting point matches the decision you are trying to make. Comparing an intraday fill with a line anchored three weeks ago mixes two different tasks. Likewise, using session VWAP to judge what has happened since a major event throws away the event context as soon as a new session begins.
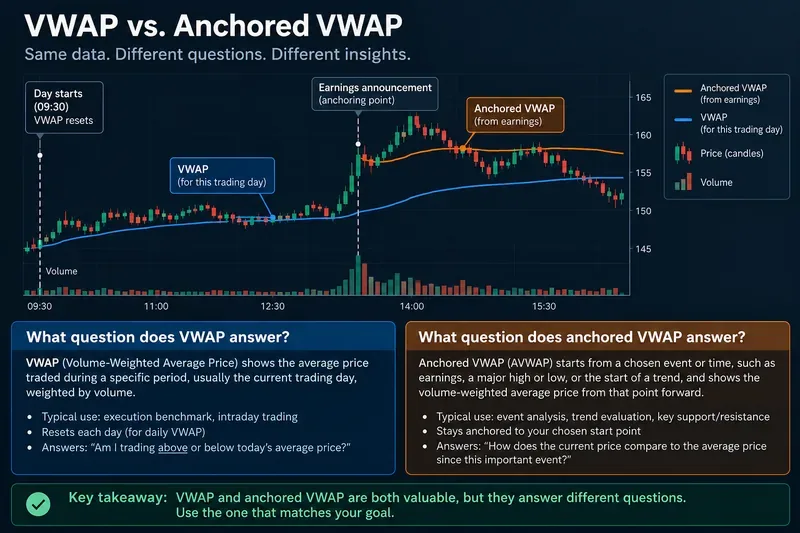
An illustrative chart shows the core difference: session VWAP measures the volume-weighted average for the defined trading day, while anchored VWAP measures the volume-weighted average from a selected event forward.
What question are you actually trying to answer?
Start here before choosing either line. VWAP is best when the relevant reference period is the current session or another regularly resetting period. Anchored VWAP is best when the reference period should begin at a specific event or time.
Question
Better-fit benchmark
Why
How does my execution compare with the market's volume-weighted price during today's session?
VWAP
The benchmark is tied to the same session in which the order was worked.
Is price trading above or below today's volume-weighted average?
VWAP
The session reset keeps the comparison focused on current-day trading.
How has price traded, on a volume-weighted basis, since a specific event?
Anchored VWAP
The calculation starts exactly where the event starts.
What is the volume-weighted reference level since a major gap, breakout, high, low, or announcement?
Anchored VWAP
The anchor preserves the event-specific history across later sessions.
What does standard VWAP measure?
VWAP stands for volume-weighted average price. Conceptually, it is the sum of price multiplied by volume divided by cumulative volume over the chosen calculation window. TradingView's documented implementation uses a price source—by default hlc3, or the average of high, low, and close for each bar—multiplies it by volume, accumulates those products, accumulates volume, and divides the two cumulative totals. See the TradingView VWAP documentation.
For intraday use, many traders mean a session VWAP that restarts with the trading session. TradingView also allows other reset periods such as week, month, quarter, year, earnings, dividends, and splits, so the label “VWAP” alone is not enough to identify the exact calculation window. The platform explicitly describes its Anchor Period setting as controlling how frequently the VWAP calculation resets.
This is also why VWAP can function as an execution benchmark rather than merely a chart indicator. U.S. market-structure guidance recognizes intraday VWAP trades whose prices are determined with reference to reported trades during a specified time period. The SEC's Regulation NMS FAQ on benchmark and VWAP trades describes that benchmark-style use.
When does VWAP give the clearest answer?
Use session VWAP when the session itself is the economic unit you care about. Examples include assessing an intraday execution, checking whether current price is above or below the day's volume-weighted average, or comparing different fills made during the same session.
It is especially useful because the benchmark is objective once the session, data source, and price source are defined. Everyone using the same inputs should obtain approximately the same result. But “approximately” matters: feeds can differ, session definitions can differ, and charting platforms can use different price-source conventions.
What changes when you anchor VWAP?
Anchored VWAP, often abbreviated AVWAP, changes the starting point. Instead of resetting automatically at the next session, the calculation begins at a time you select and keeps accumulating volume-weighted price from there. TradingView's Anchored VWAP documentation defines it as the volume-weighted average price starting from a user-selected point on the chart.
The formula is not the important difference. The question is. Anchoring says, in effect: “Ignore everything before this point; what has the volume-weighted average been since this event?”
Which anchors are reasonable?
An anchor should correspond to a hypothesis you can state before reading the line. Common examples include an earnings release, a major gap, a widely watched swing high or low, the start of a breakout, a listing date, a policy announcement, or another event that materially changes the information set available to market participants.
The key discipline is to avoid moving the anchor simply because another starting point produces a more attractive chart. Unlike a session VWAP reset, anchor selection is partly discretionary. That flexibility is the strength of AVWAP, but it is also its biggest source of overfitting.
Is anchored VWAP an “average cost basis” for everyone since the event?
Not literally. It is a volume-weighted price benchmark computed from the available price-and-volume data after the anchor. It does not reveal each participant's actual inventory, side of trade, holding period, fees, hedges, or whether shares were later sold. Saying that AVWAP is the exact break-even point for “all buyers” overstates what the data can prove.
A safer interpretation is: AVWAP summarizes where trading has occurred, weighted by volume, since the selected point. Price above or below that line can therefore be useful context, but it should not be treated as a direct measurement of every participant's profit or loss.
Which benchmark is better for trade execution?
If the objective is to judge how an order performed during a defined intraday window, ordinary VWAP is usually the cleaner benchmark because the evaluation window can match the order's working period. For example, a trader who works a large order across the regular session may compare the resulting average fill with the market's VWAP over the same period.
Anchored VWAP usually answers a different question. It is more useful when the goal is contextual analysis around a prior event rather than transaction-cost measurement for today's order. Comparing today's fill with an AVWAP anchored weeks ago may be interesting for market context, but it does not isolate today's execution quality.
Which benchmark is better for event-driven analysis?
Anchored VWAP is generally the more direct tool when the event itself defines the analysis window. Suppose a company releases results and the stock gaps sharply. A session VWAP will tell you how the stock traded on each individual day, but it will reset. An AVWAP anchored at the release can maintain one continuous reference level across subsequent sessions.
That makes it easier to ask a specific, reproducible question: “Where is price relative to the volume-weighted average since the event?” It does not tell you whether price must reverse, continue, or hold the line. It simply keeps the event window intact.
Can VWAP and anchored VWAP disagree without either being wrong?
Yes. They can show different levels because they intentionally include different data. A session VWAP may be above an AVWAP after a strong current-day rally even if the longer event-to-present average remains lower. The reverse can happen after a weak session that follows a strong post-event advance.
This is not a contradiction. It is the same reason a one-day average can differ from a multiweek average: the input window changes the answer.
What should you verify before relying on either line?
Starting point: Is the VWAP resetting by session, week, month, or another rule? For AVWAP, is the chosen anchor exact and intentional?
Session definition: Does the calculation include only regular trading hours or also extended-hours data?
Price source: Is the tool using trade prices, bar typical price, close, or another source?
Volume source: Is the volume consolidated, venue-specific, estimated, or incomplete for the instrument?
Instrument type: Centralized exchange-traded equities have different volume data characteristics from decentralized or dealer-driven markets.
Purpose: Are you evaluating execution, today's trading context, or price behavior since a specific event?
What are the most common mistakes?
Using AVWAP after choosing the anchor with hindsight
If the anchor changes every time price fails to react the way you expected, the benchmark becomes difficult to test. Define why the event matters first, then keep the anchor stable long enough to evaluate the idea.
Assuming a VWAP touch must produce support or resistance
VWAP and AVWAP are averages, not mechanical reversal rules. A chart can cross either line repeatedly. TradingView itself notes that VWAP is a lagging indicator because it is calculated from past data. Treat the line as a reference, not a guarantee.
Comparing different platforms without checking settings
Two charts can display different values even when both labels say “VWAP.” Session boundaries, extended-hours inclusion, source price, bar interval, and underlying market data can all affect the output. Verify the settings before concluding that one platform is wrong.
Quick decision checklist: VWAP or anchored VWAP?
If your question contains “today,” “this session,” or “my intraday execution,” start with session VWAP.
If your question contains “since earnings,” “since the gap,” “since the high/low,” or “since this event,” start with anchored VWAP.
If the anchor cannot be justified without looking at the subsequent price path, reconsider it.
If you are evaluating fills, match the benchmark window as closely as possible to the order's actual working window.
If two tools disagree, compare session settings, price source, volume source, and extended-hours treatment before drawing conclusions.
The practical takeaway
VWAP and anchored VWAP are not competing versions of the same benchmark. They are the same volume-weighted framework applied to different starting points. Session VWAP is strongest when the session itself is the relevant unit. Anchored VWAP is strongest when a specific event defines the beginning of the analysis.
Choosing between them is therefore less about which line is “better” and more about whether the benchmark matches the question. Define the question first, then choose the starting point that makes the comparison meaningful.