Home
» News
»
How to Spot an Altseason Before It Starts: 4 On-Chain Signals to Watch
How to Spot an Altseason Before It Starts: 4 On-Chain Signals to Watch
There is no on-chain metric that can tell you, with certainty, that an altseason is about to begin. The useful question is narrower: are several independent signs showing that liquidity, capital rotation, and real network demand are broadening beyond Bitcoin at the same time?
Consider a hypothetical example. Maya has watched a handful of large-cap altcoins rally for two weeks. Social media is calling it “altseason,” but she does not want to chase price alone. Instead, she builds a four-part on-chain checklist: stablecoin buying power, exchange flows, network activity, and realized-value metrics such as MVRV. None of these is a buy signal by itself. The goal is to see whether different datasets tell a coherent story.
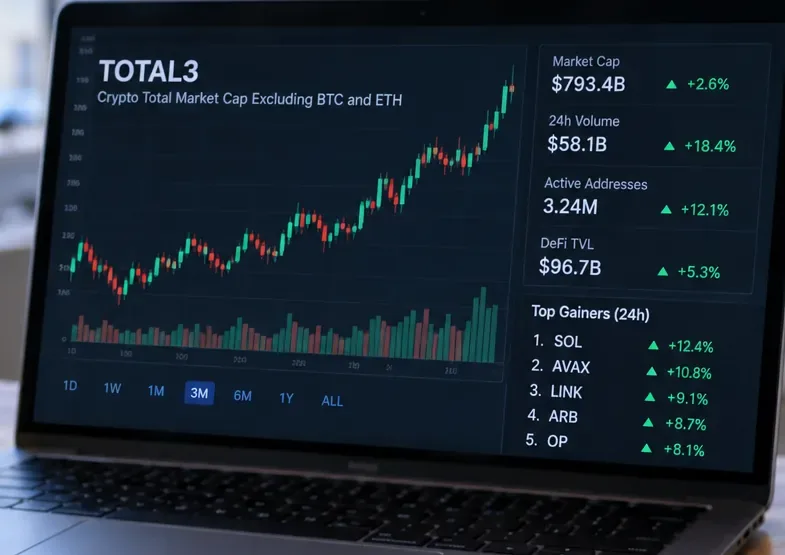
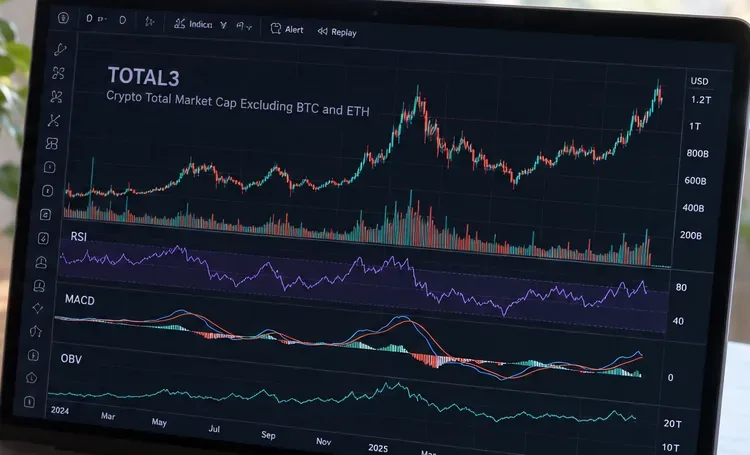
A broad-market dashboard can provide context, but price charts are only the starting point. Maya's hypothetical process looks for independent on-chain confirmation before treating a rally as a possible market-wide rotation.
First, define what you mean by “altseason”
“Altseason” is market slang, not a protocol-defined event. Traders usually use it for a period when a broad group of non-Bitcoin cryptoassets outperforms and capital rotates into riskier parts of the market. Because there is no official on-chain threshold, any method that claims one number can predict the start should be treated cautiously.
This matters because price breadth and on-chain activity are related but not identical. A token can rise on thin liquidity, derivatives positioning, exchange-specific flows, or narrative momentum without meaningful growth in users or settlement activity. Conversely, network usage can improve before token prices respond.
Maya therefore uses on-chain metrics for confirmation, not prophecy. She asks whether fresh purchasing power is entering crypto, whether coins are moving toward or away from exchanges, whether multiple networks are becoming busier, and whether valuation/profitability measures show a healthy rather than exhausted market.
Signal 1: Stablecoin liquidity is expanding—and becoming more usable
Stablecoins are one of the clearest bridges between dollar-denominated liquidity and crypto markets. A growing stablecoin base does not guarantee that money will flow into altcoins, but it can increase the pool of capital that is able to rotate into cryptoassets.
One useful framework is the Stablecoin Supply Ratio, or SSR. Glassnode defines SSR as Bitcoin's market capitalization divided by the market capitalization of tracked stablecoins. A lower SSR means the stablecoin supply has greater theoretical buying power relative to Bitcoin. The metric definition is available in the Glassnode SSR documentation.
For an altseason watch, Maya does not use SSR in isolation. She asks three questions:
Is the aggregate stablecoin supply expanding over several weeks rather than jumping for one day?
Are stablecoins actually moving onto trading venues or active DeFi ecosystems, rather than simply sitting in inactive addresses?
Is the increase broad enough to support more than one chain or one speculative niche?
Tradeoff: stablecoin expansion is an early liquidity clue, which makes it useful before price confirmation. But that also makes it ambiguous. Stablecoins can be held for yield, payments, treasury purposes, or risk reduction. More stablecoins do not automatically mean more altcoin demand.
Signal 2: Exchange netflows suggest rotation, not just deposits for selling
Exchange flow data tracks assets moving into and out of addresses identified as exchanges. Glassnode defines exchange netflow as the difference between volume flowing into exchanges and volume flowing out. Its documentation also warns that exchange metrics depend on labeled addresses and can be revised as labels improve, particularly for recent data. See the Glassnode exchange-netflow metric documentation.
That limitation is important. A large inflow is not automatically bearish and an outflow is not automatically bullish. Deposits can be collateral, market-making inventory, transfers between exchange-controlled wallets, or preparation to trade. The direction becomes more useful when interpreted across assets and over time.
In Maya's hypothetical case, she looks for a rotation pattern rather than a single spike. For example, she might see Bitcoin exchange inflows normalize while stablecoin balances available for trading rise and selected altcoins show sustained withdrawals after accumulation. That combination would be more interesting than one day of token outflows.
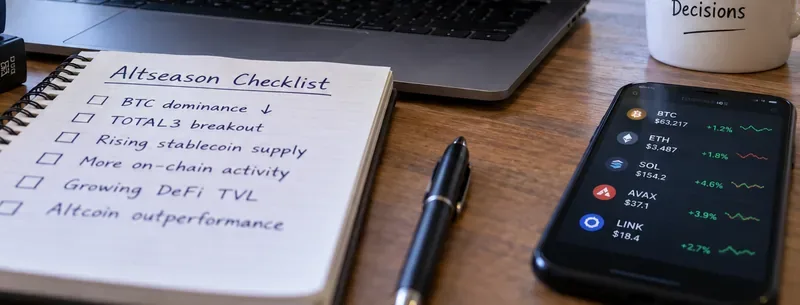
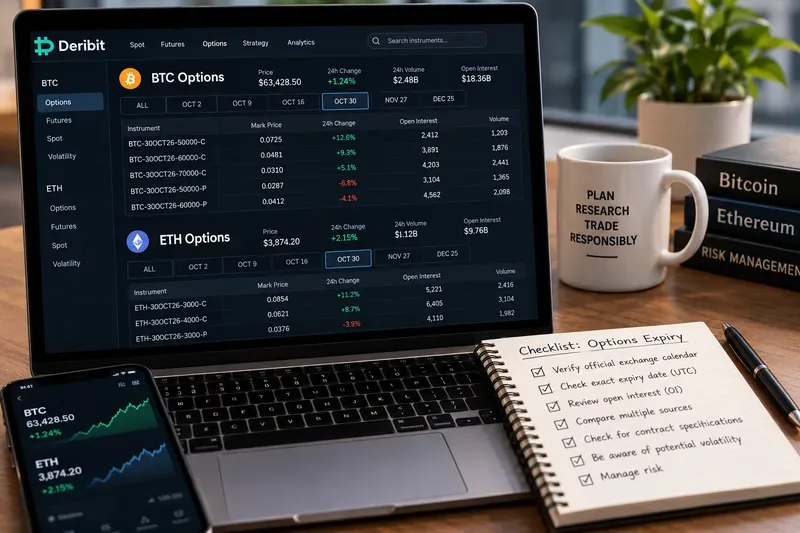
The checklist illustrates why a trader should combine several observations instead of treating one exchange-flow spike or one group of rising token prices as proof of altseason.
Tradeoff: exchange-flow metrics are close to actual market plumbing, but attribution is imperfect. Treat them as directional evidence and favor multi-day or multi-week trends over isolated transactions.
Signal 3: Network activity broadens across several ecosystems
A genuine risk-on rotation is more convincing when people are actually using multiple chains. Useful measures include active addresses, transaction counts, fee-paying users, transfer volume, and application-level activity. The exact metric must be chosen carefully because chains have different architectures.
Coin Metrics defines an active address as a unique address that was active as a recipient or originator of a ledger change during the measurement interval. Its reference-data documentation also makes clear that an address is not the same thing as a person. One user can control many addresses, and exchanges or applications can generate large volumes of address activity.
Fees add another dimension. Ethereum's official documentation explains that gas fees rise with demand for computation and blockspace; each transaction consumes gas, and users may pay priority fees when demand is high. See the Ethereum gas and fees documentation. Solana likewise exposes transaction, fee-payer, compute-unit, and fee data in its official network data dashboard.
Maya therefore avoids comparing raw transaction counts across chains as if they were equivalent. Instead, she asks whether each chain is improving relative to its own recent baseline. A useful altseason pattern would be simultaneous growth in several categories—for example, more active addresses, higher economically meaningful transfer activity, and rising fee demand—across multiple ecosystems.
Network activity is most useful when compared with each chain's own baseline. Architecture differences make raw transaction counts across chains a poor apples-to-apples comparison.
Tradeoff: network activity provides stronger fundamental confirmation than price alone, but it may arrive later. It can also be distorted by bots, incentives, airdrop farming, spam, or low-value transactions. Confirmation is more credible when several independent activity measures rise together.
Signal 4: Realized value and MVRV show whether the move is still early or already crowded
MVRV compares an asset's market capitalization with its realized capitalization. Coin Metrics defines realized capitalization as valuing units at the price when they last moved on-chain, creating an approximate aggregate cost-basis framework. MVRV is market cap divided by realized cap. The methodology is documented in Coin Metrics' market-cap and MVRV documentation.
Glassnode similarly describes high MVRV as a state in which market value has moved far above aggregate realized value, implying greater unrealized profitability and potentially more incentive to take profit. Low MVRV can indicate weak demand or undervaluation. See the Glassnode MVRV guide.
For altseason analysis, the important idea is not to import Bitcoin's historical MVRV thresholds blindly into every altcoin. Token economics, age, supply distribution, vesting, bridges, staking, and accounting models differ. Maya uses MVRV comparatively: is realized value rising along with market value, or is price racing far ahead of the on-chain cost basis?
Market momentum can look strong while on-chain valuation becomes stretched. MVRV adds a cost-basis perspective, but thresholds should be calibrated to the specific asset rather than copied blindly from Bitcoin.
Tradeoff: MVRV can help distinguish a developing move from an increasingly crowded one, but coverage and interpretation vary by asset. Realized-cap methods are less straightforward for tokens with complex issuance, bridges, privacy features, or large locked allocations.
How Maya combines the four signals in the hypothetical example
Suppose Maya's dashboard produces the following fictional observations over several weeks. These numbers are illustrative only; they are not current market data or a backtest result.
Indicator group
Hypothetical observation
What Maya concludes
Stablecoin liquidity
Supply is rising steadily and trading-venue liquidity is increasing
More potential purchasing power is available
Exchange flows
No single panic deposit; selected altcoins show persistent net withdrawals
Possible accumulation, but attribution remains uncertain
Network activity
Several chains show higher active-address, fee-payer, and transfer activity versus their own baselines
The move is broader than one token narrative
MVRV / realized value
Market values are rising, but realized value is also advancing and profitability is not at an obvious historical extreme
Demand may be building without clear evidence of cycle exhaustion
At that point, Maya would say the evidence is consistent with an emerging altcoin rotation. She still would not say “altseason confirmed.” A stronger conclusion would require market breadth and relative-performance confirmation as well—price-based evidence that many altcoins, not just a few leaders, are outperforming Bitcoin and Ethereum. Those are market indicators rather than on-chain indicators, so they belong in a separate confirmation layer.
A practical three-state framework
Instead of inventing a precise “altseason score,” classify the environment as weak, developing, or broad:
State
Typical evidence
Practical interpretation
Weak
Stablecoin liquidity flat or shrinking; isolated token rallies; network use concentrated in one chain
Likely narrative trading rather than broad rotation
Developing
Liquidity expands; exchange flows become constructive; several networks improve versus baseline
Worth monitoring, but false starts remain common
Broad
Liquidity, flows, network demand, and realized-value growth align across multiple ecosystems
Stronger evidence of a market-wide risk-on phase
This framework deliberately sacrifices some speed for reliability. If you wait for four groups of evidence, you will not catch the exact bottom. In return, you reduce the chance of mistaking a one-week meme-token rally for a durable market regime.
Common mistakes when using on-chain indicators for altseason
1. Treating active addresses as unique users
Addresses are ledger objects, not verified individuals. Wallet churn, bots, contracts, exchanges, and farming behavior can inflate counts. Use active addresses alongside fees, transfer volume, and application activity.
2. Comparing chains with incompatible transaction models
A transaction on Ethereum does not represent the same unit of economic activity as a transaction on Solana or another high-throughput chain. Focus on each network's trend relative to itself.
3. Reading every exchange inflow as selling pressure
Exchange addresses support trading, custody, collateral management, and internal transfers. Netflow trends need context, and recent labeled data can be revised.
4. Assuming stablecoin growth must become altcoin buying
Stablecoins also support payments, lending, market making, hedging, and cash-like positioning. Liquidity is a prerequisite for some rallies, not a guarantee of one.
5. Using a Bitcoin MVRV threshold on every token
Realized capitalization behaves differently across assets. Use asset-specific history and understand token supply mechanics before treating a level as meaningful.
The most useful sequence: liquidity, rotation, usage, valuation
If you want a repeatable workflow, start with liquidity. Is stablecoin purchasing power expanding? Then check rotation: are exchange flows consistent with capital moving into rather than simply through the market? Next verify usage: are multiple networks seeing sustained increases in meaningful activity? Finally assess valuation: is realized value keeping pace with market value, or has speculation already moved far ahead of the cost basis?
No sequence removes uncertainty. On-chain data can be delayed, revised, mislabeled, or structurally incomparable between chains. It also cannot capture every driver of crypto prices, including derivatives leverage, macro liquidity, regulation, token unlocks, or off-chain exchange activity.
Bottom line
The best way to spot a potential altseason before the label becomes obvious is not to hunt for one magic chart. Look for convergence: expanding stablecoin liquidity, constructive multi-day exchange-flow patterns, broadening real network usage, and realized-value metrics that support rather than contradict the move.
In the hypothetical example, Maya's edge is not prediction. It is discipline. She requires several independent datasets to agree before increasing confidence, accepts that this means entering later than the earliest speculators, and keeps price breadth as a separate confirmation layer. That tradeoff—less speed in exchange for stronger evidence—is usually more defensible than declaring altseason from a single rally.