Home
» News
»
How to Use Funding Rates to Read Market Direction in Crypto Perpetuals
How to Use Funding Rates to Read Market Direction in Crypto Perpetuals
Funding rates can help you read positioning pressure in crypto perpetuals, but they do not predict price direction by themselves. The highest-quality use of funding is to combine the rate with price behavior, the spot-versus-perpetual premium, open interest, and evidence that one side of the market is becoming crowded.
That distinction matters in 2026 because market data itself can change. For example, Bybit changed its open-interest reporting methodology on June 11, 2026 from bilateral counting to unilateral counting. The exchange said displayed open interest could fall by roughly 50% because the same market activity was no longer counted twice. If you compare current OI with older Bybit data without adjusting for that change, you can misread leverage growth or contraction. See Bybit's official open-interest documentation.
What a funding rate actually tells you
A perpetual futures contract has no fixed expiration date, so exchanges use a funding mechanism to help keep its price close to the underlying spot index. Funding is a periodic payment between long and short position holders.
Positive funding: longs pay shorts.
Negative funding: shorts pay longs.
Funding near zero: positioning pressure between the two sides is relatively balanced, at least through this mechanism.
Binance states that its perpetual funding mechanism is designed to keep the contract aligned with the spot index, with the rate derived from an interest component and a premium component. Its default interval for many perpetual contracts is eight hours, although intervals can change. Coinbase International instead applies funding hourly. Bybit also notes that funding intervals can vary by contract and can be adjusted during volatile conditions. The exact number therefore should never be compared across exchanges without first checking the contract specification.
Step 1: Read the sign, but do not trade the sign alone
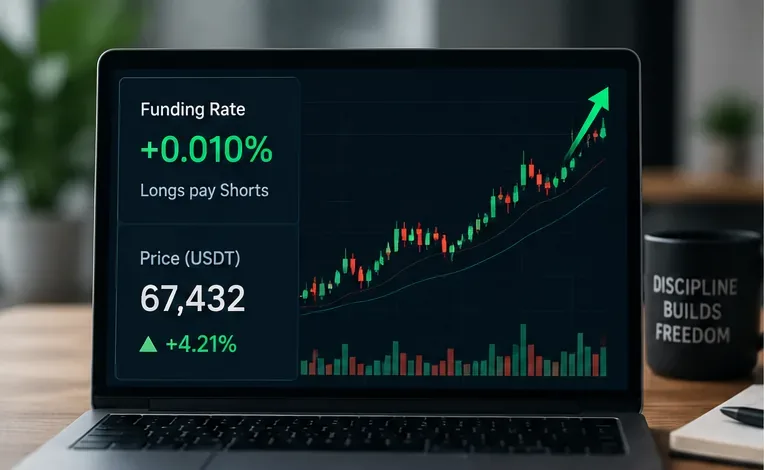
Positive funding means long positions are paying short positions. A rising market with positive funding can be healthy, but the rate by itself does not prove that price will continue higher.
Positive funding is often associated with stronger demand for leveraged long exposure. If the perpetual contract trades at a premium to spot, the funding mechanism pushes longs to compensate shorts, helping pull the perpetual price back toward the index.
The first mistake to avoid is turning that relationship into a simple rule such as “positive funding means buy” or “positive funding means short.” Both can fail.
A modest positive rate during a steady uptrend can simply mean the market is functioning normally. An unusually high positive rate after a fast price rise can instead indicate crowded long positioning and higher liquidation risk if the trend reverses.
Your goal at this stage is not to forecast. It is to classify the market as broadly long-biased, short-biased, or balanced.
Step 2: Compare funding with price direction
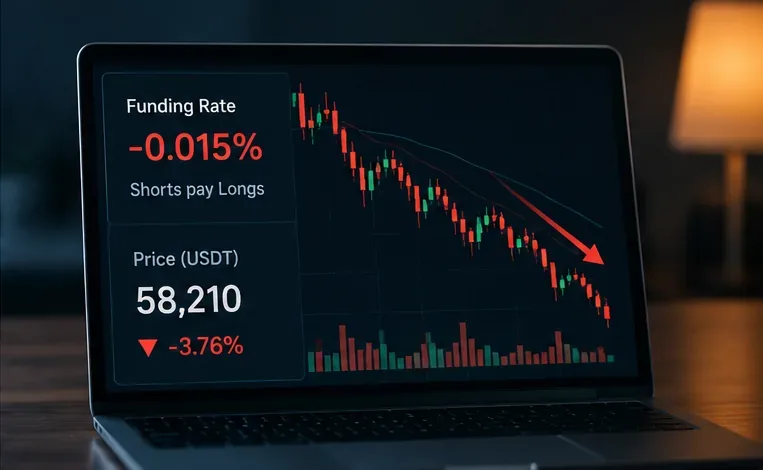
Negative funding means short positions are paying long positions. When price is also falling, the combination points to short-side pressure, but it still requires confirmation.
The signal becomes more useful when the funding direction is compared with actual price behavior.
Price
Funding
Initial interpretation
Rising
Moderately positive
Long demand is supporting the trend; not automatically overheated.
Rising
Very positive and accelerating
Trend may still be strong, but crowded-long risk is increasing.
Falling
Negative
Short pressure is consistent with the decline.
Falling
Very negative
Short crowding may be extreme; squeeze risk rises if price stabilizes.
Rising
Negative
Potential short squeeze or spot-led rally; investigate further.
Falling
Positive
Longs may be trapped or slow to unwind; downside liquidation risk can increase.
The most interesting cases are often divergences. If Bitcoin is rising while funding remains negative, shorts may be paying to stay positioned against a market that is moving higher. That can support a squeeze if those positions begin closing. Conversely, if price falls while funding remains stubbornly positive, leveraged longs may still be crowded into a weakening market.
Step 3: Look for crowding, not just direction
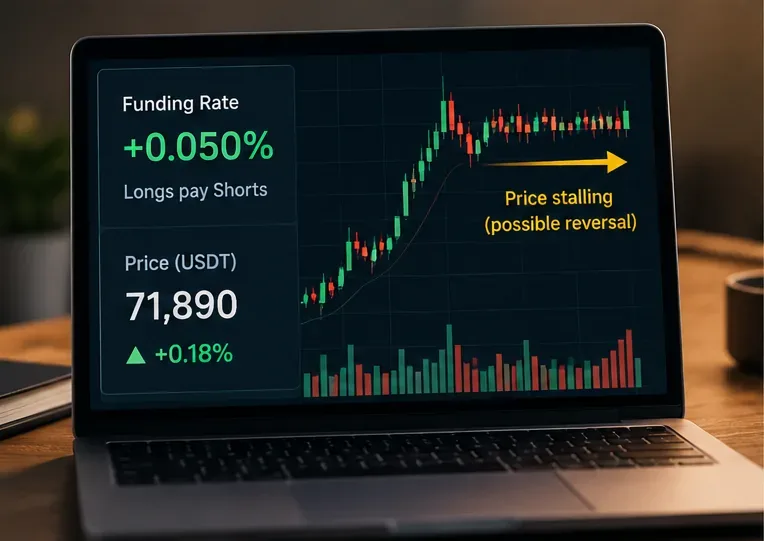
A rising funding rate combined with stalling price can be a warning that leveraged longs are becoming crowded. It is a risk signal, not proof of an imminent reversal.
A funding rate is most useful when you ask how unusual it is relative to that contract's own recent history. A rate that is ordinary for one altcoin during a speculative phase may be extreme for BTC during a quiet market.
Watch for three signs of crowding:
Funding is far above or below its recent range.
Funding keeps moving further in one direction while price momentum weakens.
The perpetual premium or discount becomes large while leverage continues to build.
If funding becomes highly positive but price stops advancing, new longs may be paying increasingly high carry without receiving much additional upside. That is not enough to short immediately. The better conclusion is that the reward-to-risk of chasing the long side has worsened.
The same logic works in reverse. Extremely negative funding during a selloff may reflect genuine bearish pressure, but if price stops making new lows, the market can become vulnerable to a short squeeze.
Step 4: Confirm with open interest
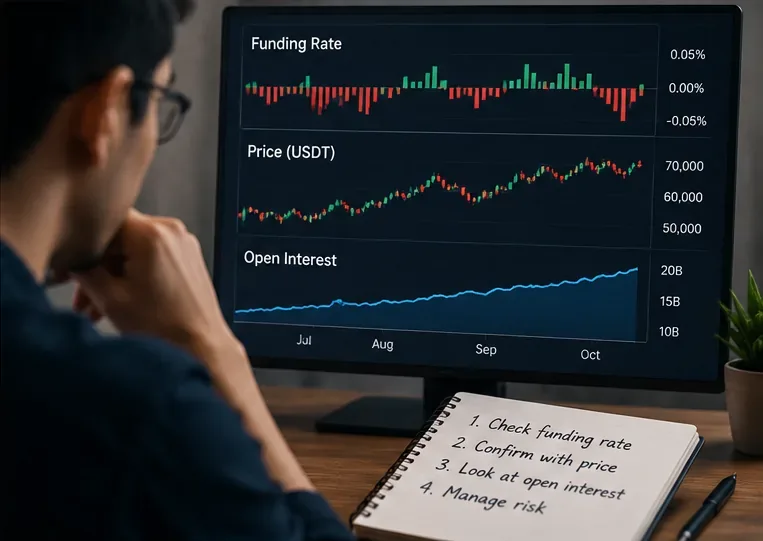
Funding becomes more useful when it is evaluated with price and open interest. Open interest shows how much futures positioning remains active, but it does not reveal direction by itself.
Open interest (OI) is the amount of futures or options positioning that remains open rather than closed or settled. Binance's July 2026 explainer notes that rising OI usually indicates more active positioning, while falling OI suggests positions are being closed. It also emphasizes that OI does not directly tell you where price will move. See the official Binance open-interest explanation.
Funding and OI together create a more useful decision matrix:
Price
Funding
Open interest
What to investigate
Up
Positive
Rising
Fresh leveraged longs are entering. Trend confirmation is possible, but monitor crowding.
Up
Negative
Rising
Shorts may be adding against the rally. Squeeze risk can increase.
Down
Positive
Rising
Longs may be adding into weakness. Liquidation risk deserves attention.
Down
Negative
Rising
Fresh short exposure is building. Trend continuation is possible, but crowded-short risk grows.
Sharp move
Any
Falling quickly
The move may be driven by position closing or liquidations rather than fresh conviction.
What a good funding-rate analysis should achieve
A useful analysis should leave you with a clearer description of market positioning, not a false sense of certainty. By the end, you should be able to answer four questions:
Which side is paying funding?
Is the rate normal or extreme for this specific contract?
Is price confirming or diverging from the positioning bias?
Is open interest expanding, stable, or being flushed out?
If you cannot answer those questions, funding should not be used as a directional input yet.
When the signal is strongest
Funding tends to be most informative when several independent observations agree. For example, a sustained uptrend, steadily rising OI, a moderate positive funding rate, and a manageable perpetual premium can describe a healthy leveraged trend. Likewise, falling price, negative funding, and expanding OI can confirm that fresh short exposure is entering.
Contrarian setups are different. Extreme positive funding plus stalling price and accelerating OI can warn of crowded longs. Extreme negative funding plus stable or rising price can warn of crowded shorts. In both cases, the better trade often comes only after price confirms that the crowded side is losing control.
When to change your approach
Stop relying on a funding-based setup when the surrounding evidence changes. Reassess if:
Price breaks the level that supported your original interpretation.
Open interest collapses after a liquidation event.
Funding normalizes quickly, removing the crowding condition.
The exchange changes its funding interval, cap, calculation method, or OI reporting methodology.
Spot price starts leading the perpetual market in the opposite direction.
The June 2026 Bybit OI methodology change is a good example of the fourth case. A sudden structural drop in displayed OI caused by a reporting change is not the same thing as traders closing half their positions.
Funding-rate thresholds should be relative, not universal
There is no single funding number that means “overheated” across all exchanges and assets. Funding formulas, settlement intervals, caps, underlying volatility, and liquidity differ. An eight-hour rate should not be compared directly with an hourly rate without normalization, and an altcoin perpetual should not be judged by a BTC threshold copied from another market regime.
A better method is to compare the current rate with its own recent distribution: for example, the previous 30 or 90 days for the same contract and exchange. Look at percentile rank, persistence, and the pace of change rather than a universal cutoff.
Funding is also a holding cost
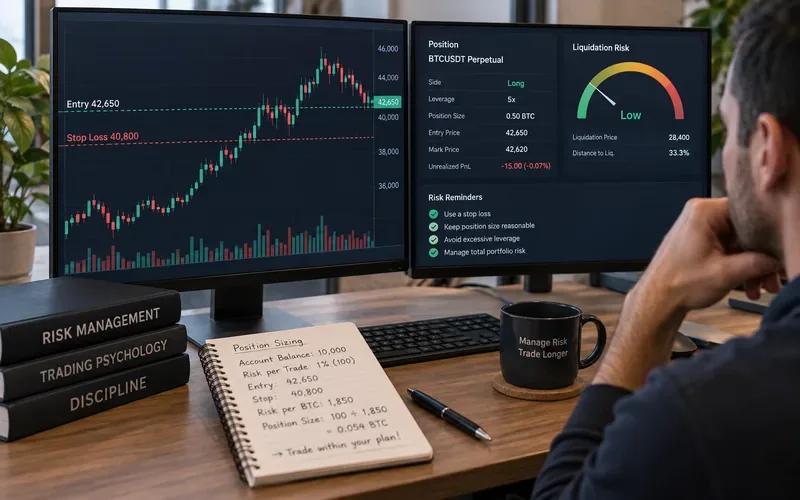
Direction is not the only reason funding matters. If you hold a leveraged position across repeated funding settlements, the payments can materially change the trade's economics. Binance defines the payment as position notional multiplied by the funding rate, while Coinbase describes the same basic relationship for its perpetual products.
A correct directional thesis can still produce a poor result if the position is held too long at an expensive funding rate. Before entering, estimate how much funding would cost over your expected holding period and include it in the risk calculation.
Common mistakes
Shorting every positive funding reading. Positive funding can persist during powerful bull trends.
Buying every negative funding reading. Negative funding can remain negative while price continues to fall.
Ignoring the interval. Hourly and eight-hour rates are not directly comparable.
Ignoring open-interest methodology. Exchange reporting changes can distort historical comparisons.
Using one exchange as the whole market. Funding can differ across venues because positioning and formulas differ.
Forgetting spot. A perpetual signal is more reliable when you know whether spot demand or derivatives leverage is leading the move.
A practical decision rule
Use funding first as a positioning thermometer, second as a crowding indicator, and only then as part of a directional thesis. A high-quality setup usually requires price confirmation and one additional independent signal such as open interest, spot-led buying or selling, or a persistent premium/discount.
If funding is extreme but price has not confirmed a reversal, treat that as a warning rather than an entry signal. If funding, price, and OI all tell the same story, confidence in the interpretation improves—but the setup can still fail. Perpetual futures are leveraged instruments, and liquidation risk can dominate any statistical edge.
Bottom line
Funding rates are useful because they reveal who is paying to maintain leveraged exposure and how strongly the perpetual market is deviating from spot. The sign gives you the initial positioning bias; the size tells you whether that bias may be crowded; price tells you whether the market agrees; and open interest shows whether leverage is expanding or being unwound.
The goal is not to predict the next candle. It is to improve the quality of your market read, identify when a trend is supported by positioning, recognize when leverage has become one-sided, and know when the evidence is no longer strong enough to justify the trade.