Home
» News
»
Order Blocks and Smart Money Concepts on Crypto Charts: What They Show—and What They Don’t
Order Blocks and Smart Money Concepts on Crypto Charts: What They Show—and What They Don’t
The most useful way to apply Smart Money Concepts (SMC) to crypto is to treat them as a structured chart-reading framework—not as proof that institutions are secretly controlling every move. Order blocks, breaks of structure, fair value gaps, and liquidity sweeps can help you organize price action and define entries, invalidation points, and targets. They become much less reliable when traders treat every candle zone as institutional evidence or assume an SMC label predicts the next move by itself.
That distinction matters in crypto because markets trade around the clock, liquidity differs sharply across venues, and leveraged positioning can produce violent moves that look meaningful on a chart but have several possible causes. The best use of SMC is therefore conditional: identify market structure first, mark a potential reaction zone, then look for confirmation from price, volume, and—when available—the actual order book.
Important limitation: terms such as “order block,” “break of structure” (BOS), “change of character” (CHoCH), “fair value gap” (FVG), and “liquidity sweep” are widely used trader vocabulary, but there is no single exchange, regulator, or academic standard that defines the full SMC framework. The definitions below use common trading conventions and should be tested rather than treated as objective market laws.
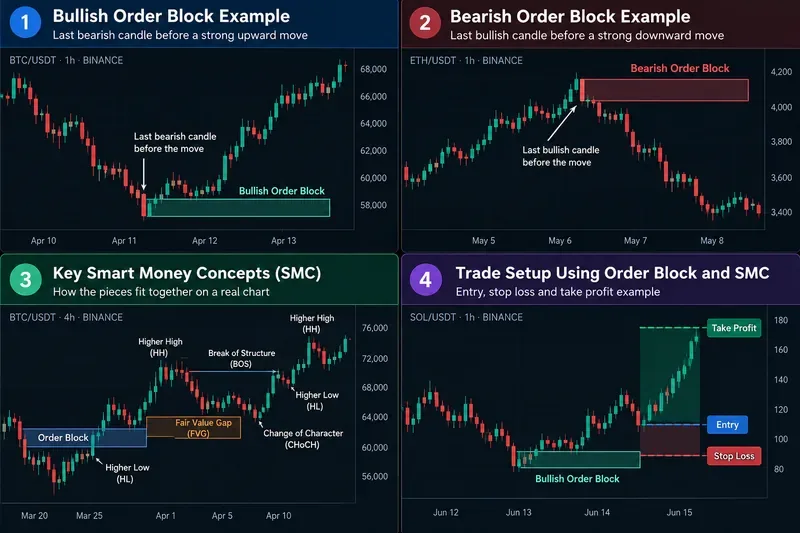
A practical SMC chart map: order blocks are treated as candidate reaction zones, while market structure and invalidation determine whether a setup remains valid. Prices and labels are illustrative, not live trade signals.
What is an order block in practical terms?
An order block is usually marked as the final opposing candle or small consolidation area before a strong directional move that breaks a meaningful swing level. In a bullish setup, traders often mark the last bearish candle before an impulsive rally. In a bearish setup, they often mark the last bullish candle before a sharp decline.
The useful idea is not that the candle contains a visible cache of “institutional orders.” A candlestick chart does not reveal who placed each order. The useful idea is that the zone gives you a precise area to watch if price returns.
For example, imagine BTC trades between $66,000 and $67,000, prints one final bearish hourly candle down to $65,700, then rallies strongly through a prior swing high at $68,000. A trader might mark the bearish candle's range as a bullish order block. If BTC later returns to that area, the zone becomes interesting only if buyers actually respond. If price closes decisively through it, the thesis is weakened or invalidated.
How does market structure fit into SMC?
Market structure is the foundation. Before drawing order blocks, classify the sequence of swings.
Higher high (HH): price exceeds the prior significant swing high.
Higher low (HL): a pullback holds above the prior significant swing low.
Lower high (LH): a rebound fails below the prior significant swing high.
An uptrend normally contains higher highs and higher lows. A downtrend normally contains lower lows and lower highs. This is basic price structure, and it is more objective than many later SMC labels because the swing points are visible on the chart.
What is a Break of Structure (BOS)?
A Break of Structure generally means price breaks a prior swing in the direction of the prevailing trend. In an uptrend, a move above the previous meaningful high can be labeled bullish BOS. In a downtrend, a move below the previous low can be labeled bearish BOS.
The word meaningful is important. If you mark every tiny intrabar high and low, almost every chart will produce constant “structure breaks.” Choose a timeframe and swing definition before analyzing the setup.
What is a Change of Character (CHoCH)?
A Change of Character is commonly used for an early break against the existing trend. If a market has been making higher highs and higher lows, then falls through a prior higher low, some traders call that a bearish CHoCH. It is a warning that the existing structure may be changing, not proof that a full reversal has begun.
That distinction prevents one of the most common SMC mistakes: shorting immediately after the first bearish break in a strong uptrend. A CHoCH can lead to a reversal, but it can also be a deeper pullback before the original trend resumes.
What is a fair value gap, and should you expect it to fill?
A fair value gap (FVG) is a three-candle pattern used to describe a fast move that leaves little or no overlap between the first and third candle around the middle candle's impulse. Traders interpret the zone as an area where price moved quickly and may later revisit.
The phrase can be misleading. Nothing guarantees that the market considers the zone “fair,” and price does not have to return to it. A better description is an imbalance zone on the chart.
Volume tools can provide a more directly measurable complement. TradingView's official documentation explains that Volume Profile shows how much activity occurred at different price levels and identifies levels such as the Point of Control (POC), where the most volume traded in the selected period. TradingView also explicitly describes Volume Profile as a reactive tool based on what has already happened, rather than a prediction of what must happen next. See TradingView's Volume Profile documentation.
What does “liquidity sweep” mean on a crypto chart?
In SMC language, a liquidity sweep usually means price briefly trades beyond an obvious prior high or low and then reverses. The idea is that stop orders and breakout orders tend to cluster around visible levels, so a move through those levels can trigger concentrated execution.
The chart alone does not prove who caused the move or whether it was deliberately engineered. On an exchange, actual liquidity is represented by resting bids and asks in the order book. Coinbase's official Advanced Trade documentation describes the order book as the current ladder of open orders, and its depth chart as a visual representation of bid and ask orders together with cumulative size. That data is observable; the intention behind a sweep is not. See the Coinbase Advanced dashboard documentation.
A more disciplined interpretation is therefore: “price traded through a prior high, then failed to hold above it,” rather than “smart money hunted every retail stop.” The first statement is visible and testable; the second requires knowledge the chart does not provide.
How do you apply an order block to an actual crypto setup?
Consider a hypothetical BTC/USDT four-hour chart.
Define the trend. BTC has formed a higher low at $64,000 and then a higher high at $70,000.
Identify the impulse that caused the BOS. The rally from $65,200 to $70,000 breaks the prior high at $68,500.
Mark the candidate order block. The final bearish candle before that impulse spans approximately $64,900 to $65,600.
Wait for the return. Do not assume the zone will hold. Let price retrace into it.
Require a response. Examples include rejection wicks, a lower-timeframe structure shift back upward, increased buying volume, or a failure to sustain closes below the zone.
Define invalidation. A decisive close beneath the block and the swing low may invalidate the long thesis.
Choose a target based on structure. Prior highs, a liquidity area, or a measured risk-to-reward objective can provide a clearer exit than “hold until it pumps.”
The order block is only one input in this sequence. The actual trade logic comes from location + structure + confirmation + invalidation.
When is an order block stronger?
There is no universally validated scoring system, but a zone is generally more useful when several observable conditions line up:
Condition
Why it can matter
It precedes a clear structural break
The zone is tied to a meaningful price expansion rather than an arbitrary candle.
The impulse is strong and relatively clean
It shows that price left the area with directional conviction.
The zone has not been revisited repeatedly
Repeated tests can weaken the practical usefulness of a reaction area.
Higher-timeframe structure agrees
A one-hour bullish block inside a daily uptrend has different context from one directly beneath major daily resistance.
Volume or order-book data supports the reaction
This adds measurable evidence beyond the SMC label.
Invalidation is nearby and logical
A setup is easier to manage when the risk boundary is clear.
When should you ignore an order block?
Ignore it when you have to force the definition. If a chart contains ten overlapping blocks, three competing FVGs, and multiple possible BOS labels, the framework is no longer reducing uncertainty.
Also be cautious when:
the block appears in the middle of a choppy range with no meaningful displacement;
price has already traded through the zone several times;
the setup conflicts with the dominant higher-timeframe structure;
the market is extremely thin and a few trades can distort candles;
a scheduled macro event or exchange-specific event is creating abnormal volatility;
the required stop is so wide that the risk no longer fits your plan.
Can the order book confirm an SMC setup?
It can add context, but it should not be treated as perfect confirmation. Resting orders can be canceled before execution, and visible depth on one exchange represents that venue, not the entire global crypto market.
Still, the order book gives you data that candlestick labels cannot. Coinbase explains that maker orders rest on the book, while orders that immediately execute against existing liquidity are taker orders. A trader watching a bullish order block can therefore ask practical questions: Is bid depth appearing near the zone? Is the spread widening? Are buyers repeatedly absorbing sell pressure? Are trades actually occurring there?
Volume Profile can help distinguish a visually attractive zone from one where meaningful trading activity actually occurred. TradingView defines the Point of Control as the price level with the highest traded volume during the selected period and the value area as the range containing a chosen percentage of volume, commonly 70% by default.
If an order block overlaps a high-volume node, it may represent an area where the market previously accepted price. If it lies in a low-volume region, price may move through it faster. Neither outcome is guaranteed, but the volume profile gives you a measurable reason to treat two visually similar blocks differently.
The framework can be applied to both, but liquidity quality matters. BTC and major pairs generally provide deeper markets and more continuous price discovery than thin altcoins. On low-liquidity assets, one large order can create a dramatic wick, apparent BOS, or “liquidity sweep” that looks structurally important but is mostly a consequence of shallow depth.
If you are learning the framework, start with liquid pairs and a consistent timeframe. That makes it easier to compare setups and reduces the chance that random market microstructure dominates the chart.
Which timeframe works best?
There is no universal best timeframe. A practical approach is to separate context from execution.
For example, use the daily or four-hour chart to determine the broader swing structure and major order blocks, then use the one-hour or 15-minute chart to look for a more precise entry. If the lower timeframe shows a bullish CHoCH inside a higher-timeframe bullish order block, the two layers support the same thesis.
The danger is drilling down until you find the signal you want. If the daily trend is bearish, the four-hour chart is at resistance, and you keep moving to five-minute data until you find a bullish BOS, the process has become confirmation-seeking rather than analysis.
What is the biggest mistake traders make with SMC?
The biggest mistake is treating labels as causes. A rectangle called “order block” does not force price to bounce. A prior high called “liquidity” does not guarantee a stop hunt. A fair value gap does not have to fill. BOS and CHoCH do not eliminate false breaks.
SMC is most useful when it helps you create a falsifiable trade plan:
Context: What is the higher-timeframe structure?
Location: Why does this zone matter?
Trigger: What must price do before entry?
Invalidation: What specific behavior proves the idea wrong?
Target: Where will profits be taken?
Risk: How much are you prepared to lose if the setup fails?
If those questions cannot be answered, adding more SMC terminology will not improve the setup.
Does SMC give you an edge in crypto?
It can provide an edge if the rules are defined precisely enough to test and if they improve your entries, exits, or risk control. It does not provide an edge simply because a chart can be labeled after the fact.
A useful test is to collect at least 50 to 100 examples using the same pair, timeframe, definition of BOS, definition of order block, entry trigger, and stop rule. Track the result after fees and slippage. If you constantly redraw the zones or redefine CHoCH after seeing the outcome, the framework cannot be evaluated objectively.
This is especially important when leverage is involved. The U.S. Commodity Futures Trading Commission warns that leverage amplifies both gains and losses in virtual-currency derivatives. A technically elegant SMC setup can still produce a large loss if position sizing is excessive. See the CFTC virtual-currency trading risk advisory.
Bottom line
Order blocks and Smart Money Concepts are best used as a map, not a prediction engine. The strongest part of the framework is its insistence on market structure, location, and invalidation. The weakest part is the temptation to assign hidden institutional intent to every swing.
On crypto charts, start with observable structure. Mark only order blocks connected to meaningful displacement or a structural break. Use FVGs and liquidity sweeps as context rather than certainty. Check volume and, when possible, actual order-book depth. Most importantly, define the point where the trade is wrong before you enter.
If an SMC setup cannot be described in rules that another trader could reproduce without seeing the future candles, it is probably too subjective to trust with real money.