Home
» News
»
Realized Cap & NUPL: How to Spot Bitcoin Market-Top Risk
Realized Cap & NUPL: How to Spot Bitcoin Market-Top Risk
Realized Cap and NUPL are two of Bitcoin’s most useful on-chain metrics for understanding where investors sit between fear, confidence, and euphoria. They do not predict an exact market top. What they can do is help you recognize when the market is carrying unusually large unrealized profits and when price has moved far above the network’s estimated aggregate cost basis.
For a new analyst, that distinction matters. The goal is not to find one number that says “sell now.” The goal is to build a repeatable process: understand what each metric measures, compare current conditions with past regimes, look for confirmation from other data, and avoid treating historical thresholds as laws.
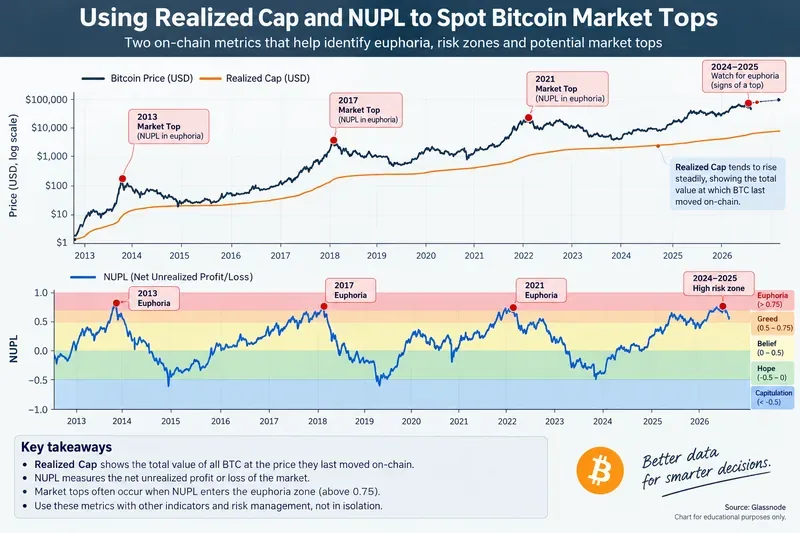
Schematic visualization of how Bitcoin price, Realized Cap and NUPL can be compared across market cycles. It is an educational illustration, not a live market chart or a trading signal.
Start with the basic idea: market cap is not the same as realized cap
Bitcoin’s ordinary market capitalization is simple: current price multiplied by circulating supply. Every coin is effectively valued at today’s market price, whether it last moved five minutes ago or has been dormant for years.
Realized Cap, short for realized capitalization, uses a different approach. Instead of valuing every unit at the current price, it values each unspent transaction output, or UTXO, at the price of Bitcoin when that output was last moved on-chain. A UTXO is simply a discrete chunk of bitcoin recorded by the Bitcoin transaction model.
Glassnode describes Realized Cap as an estimate of the network’s aggregate cost basis. Coin Metrics uses a similar interpretation, noting that it can approximate the average cost basis of current holders. The exact result depends on the provider’s methodology and data adjustments, so values from different services may not be identical.
During a strong bull market, spot price can rise much faster than Realized Cap. That widening gap means the market value of Bitcoin is moving far above the price basis at which much of the supply last changed hands. In plain English, many holders are sitting on large paper profits.
That condition is not automatically bearish. Bull markets can sustain large unrealized profits for months. But the larger the gap becomes, the more potential profit there is for holders to realize by selling. Realized Cap therefore gives you a baseline for asking whether price is becoming stretched relative to the capital embedded in the network.
Next, understand NUPL
NUPL means Net Unrealized Profit/Loss. It estimates whether the Bitcoin network as a whole is sitting in net unrealized profit or net unrealized loss, normalized by market capitalization.
The standard formulation documented by Glassnode is:
NUPL = (Market Cap − Realized Cap) / Market Cap
The same metric can also be described as Relative Unrealized Profit minus Relative Unrealized Loss. A value above zero means the network is in aggregate unrealized profit. A value below zero means aggregate unrealized loss is larger.
Suppose Bitcoin’s market cap were $2 trillion and its Realized Cap were $800 billion. NUPL would be:
($2.0T − $0.8T) / $2.0T = 0.60
A NUPL of 0.60 would mean that the difference between market value and the estimated aggregate realized cost basis equals 60% of market capitalization. It does not mean that every holder is up 60%, nor does it mean a 60% correction is coming.
How beginners should read the classic NUPL zones
Glassnode’s early NUPL research split the metric into bands at 0, 0.25, 0.50, and 0.75. The research explicitly describes those thresholds as arbitrary, even though they historically mapped to recognizable phases of Bitcoin’s macro cycles. That warning is important: use the bands as context, not as fixed laws of nature.
NUPL range
Common interpretation
What a beginner should infer
Below 0
Net unrealized loss
Many coins are underwater; conditions have historically been associated more with bear-market stress than market tops.
0 to 0.25
Early recovery / modest profit
The market has returned to aggregate profit, but broad euphoria is not evident from NUPL alone.
0.25 to 0.50
Growing profitability
Profits are expanding, often consistent with a healthier bull-market phase.
0.50 to 0.75
High profitability
Risk deserves more attention because a large share of market value reflects unrealized gains.
Above 0.75
Historically extreme profitability
Past cycles have seen major tops near very high NUPL readings, but the threshold is not a countdown clock.
Prepare a small dashboard before trying to spot a top
You do not need dozens of indicators. A compact dashboard is easier to interpret and harder to overfit. At minimum, track:
Bitcoin price on a daily and weekly view.
Realized Cap.
NUPL.
A longer-term comparison, such as the current value versus previous cycle ranges.
At least one independent confirmation metric rather than another transformation of the same inputs.
Useful confirmation candidates include MVRV, realized profit and loss, SOPR, or holder-cohort metrics. MVRV, for example, compares market cap with Realized Cap and therefore asks a related valuation question. Because it shares Realized Cap as an input, do not mistake agreement between NUPL and MVRV for two fully independent signals.
A practical process for evaluating top risk
1. Ask whether price is far above the realized cost basis
Start with the relationship between market value and Realized Cap. If price accelerates while Realized Cap rises more slowly, aggregate paper profits are usually expanding. This is the foundation for the rest of the analysis.
2. Check whether NUPL is entering a historically elevated regime
Do not react to a single daily spike. Look at the weekly trend and ask whether NUPL has remained elevated. Historically, sustained high readings have been more informative about a mature bull-market regime than one isolated print.
3. Watch the direction, not only the level
A high NUPL that is still rising tells a different story from a high NUPL that has rolled over while price struggles to make progress. The latter can suggest that profitability is no longer expanding at the same pace. It still does not prove that the cycle high is in.
4. Add holder behavior
Glassnode also publishes Short-Term Holder NUPL and Long-Term Holder NUPL. The short-term cohort uses coins younger than 155 days, while the long-term cohort uses coins at least 155 days old under Glassnode’s methodology. Comparing the two can help separate the behavior of newer entrants from more seasoned holders.
5. Look for confluence with actual selling behavior
NUPL measures unrealized profit or loss. It tells you about the financial incentive to sell, not whether holders are actually selling. That is why realized profit/loss metrics are useful companions. If elevated NUPL appears alongside large realized profits and heavy distribution, the evidence for a mature, profit-taking market becomes stronger.
Why there is no universal NUPL number that marks the top
Market structure changes. Bitcoin’s liquidity, institutional participation, derivatives market, exchange infrastructure, custody patterns, ETFs, and holder composition are not constant across cycles. A threshold that was extreme in one era may be less extreme in another.
Glassnode has therefore also used statistical risk frameworks that compare NUPL with moving averages and standard-deviation bands rather than relying only on the classic fixed 0.75 threshold. This is a useful lesson for beginners: a metric can remain valuable even when the best interpretation evolves.
In other words, “NUPL above 0.75 means the top” is too simplistic. A stronger statement is: unusually high NUPL indicates unusually large unrealized profitability, which historically has been associated with higher late-cycle risk.
Common mistakes to avoid
Treating NUPL as a timing indicator. It is better at describing market regime and profitability than naming the exact day of a peak.
Ignoring methodology differences. Providers may adjust supply, lost coins, entities, or historical data differently. Compare like with like.
Using only one timeframe. Daily noise can make an indicator look more dramatic than the weekly structure.
Assuming every coin’s last move equals a real investor purchase. Coins can move between wallets controlled by the same entity. Realized Cap is an estimate of aggregate cost basis, not a perfect ledger of purchase prices.
Overfitting old cycles. Drawing thresholds to match three historical peaks can create false confidence about the next one.
Confusing high profit with immediate selling. Investors can remain profitable for a long time before they distribute.
A beginner-friendly top-risk checklist
When evaluating whether Bitcoin may be in a late-cycle zone, ask these questions in order:
Is spot price materially above the realized cost basis?
Is NUPL elevated relative to its own history?
Has NUPL stayed elevated for weeks rather than hours?
Is NUPL still expanding, or is it rolling over?
Are short-term and long-term holders both carrying large profits?
Are realized profit metrics showing substantial profit-taking?
Does price still confirm the bullish trend, or is momentum weakening?
Would the conclusion change if you removed one indicator from the analysis?
If several independent answers point toward extreme profitability, distribution, and weakening price confirmation, market-top risk is more credible. If only NUPL looks high while demand remains strong and realized selling is modest, the market may simply be in a powerful bull phase.
The most useful way to think about Realized Cap and NUPL
Realized Cap gives you a rough map of where capital entered the network. NUPL tells you how far current market value sits above or below that cost basis as a proportion of market cap. Together, they turn the vague idea of “everyone is in profit” into something measurable.
For spotting a Bitcoin market top, their strongest use is not prediction but risk recognition. Rising Realized Cap can show that new capital is being absorbed. A widening market-cap premium can show expanding paper wealth. High NUPL can show that the incentive to realize gains is becoming unusually large. When those conditions combine with actual profit-taking and weakening price behavior, the market deserves more caution.
As of September 2026, the core definitions above remain consistent with the current Glassnode documentation reviewed for this article. Historical relationships can change, and no on-chain indicator can guarantee a future market top. Use these metrics as analytical context, not as personalized investment advice.