Home
» News
»
Scalping Crypto Volatility: Best Indicators for 15-Minute Charts
Scalping Crypto Volatility: Best Indicators for 15-Minute Charts
Crypto scalping on a 15-minute chart is not about finding one indicator that predicts the next candle. The useful job of indicators is narrower: they help classify trend, momentum, volatility, and participation so a trader can decide whether a setup is worth considering. That distinction matters because crypto can move quickly, trades around the clock, and can punish delayed entries with spread, slippage, and leverage-related losses.
The strongest 15-minute indicator stack is therefore usually a small group of tools that answer different questions. A practical starting combination is session VWAP for intraday bias, RSI for momentum, ATR for volatility, Bollinger Bands for compression and expansion, and volume for participation. None of these has been verified as universally profitable, and no fixed parameter set is “best” for every coin, exchange, or volatility regime.
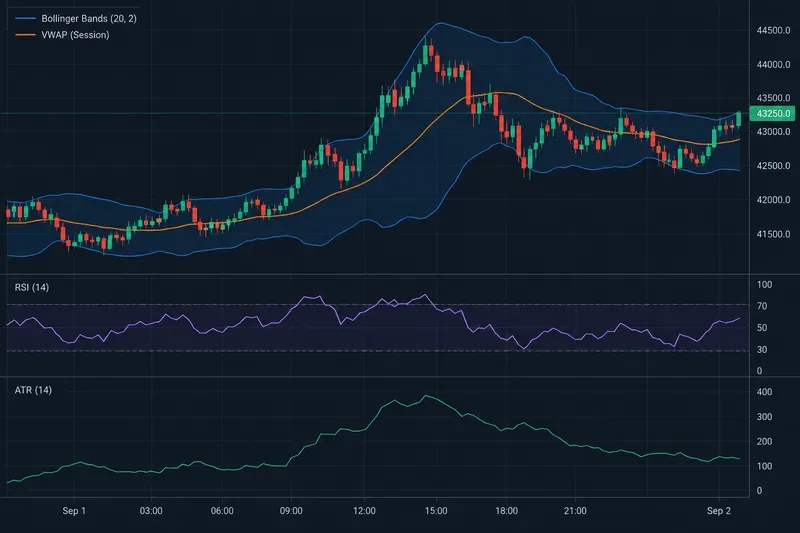
A conceptual 15-minute crypto chart showing how Bollinger Bands, session VWAP, RSI, and ATR can separate price direction, momentum, and volatility. The plotted values are illustrative rather than a live market signal.
What is actually verified about these indicators?
The formulas and intended measurements are well documented. TradingView's VWAP documentation describes VWAP as an average price weighted by volume and notes that it is commonly used on intraday charts. RSI measures the magnitude and speed of directional price changes on a 0-to-100 scale. ATR measures volatility rather than direction. Bollinger Bands place volatility-based bands around a moving average. These definitions are established; the profitable way to combine them is not.
Action: Use each indicator only for the question it is designed to answer. Do not treat a volatility indicator as a direction signal or a momentum extreme as an automatic reversal.
Best indicators for a 15-minute crypto chart
Indicator
Main job
Useful baseline
Do not assume
Session VWAP
Intraday bias and average traded price
Session anchor; default price source
Price above VWAP guarantees a long trade
RSI
Momentum
14 bars
70 means “must sell” or 30 means “must buy”
ATR
Current volatility
14 bars
A rising ATR tells you the direction
Bollinger Bands
Volatility compression and relative price location
20-bar basis, 2 standard deviations
A band touch is automatically a reversal
Volume
Participation behind a move
Compare with recent bars on the same market
Volume is directly comparable across every exchange or product
1. Session VWAP: the best first filter for intraday bias
VWAP is especially useful on a 15-minute chart because it gives a simple reference for where price is trading relative to a volume-weighted average. TradingView also notes that VWAP can lag because it is calculated from past data. That makes it more useful as context than as a precise entry trigger.
A common interpretation is that sustained trading above VWAP supports a bullish intraday bias, while sustained trading below it supports a bearish bias. In a sideways market, price may cross VWAP repeatedly and produce weak signals. For crypto, which trades continuously, the session anchor matters. Different platforms and symbols can define session boundaries differently, so a trader should verify when the VWAP resets rather than assuming every chart uses the same daily boundary.
Action: Before taking a 15-minute setup, label the market as above, below, or repeatedly crossing VWAP. If it is repeatedly crossing, reduce confidence in trend-following entries.
2. RSI: momentum, not a standalone reversal switch
RSI is often misunderstood. Its classic 70 and 30 zones are commonly described as overbought and oversold, but that does not mean price must reverse when those levels are reached. Strong trends can keep RSI elevated or depressed for many bars. On a 15-minute chart, an RSI length of 14 means 14 chart bars, not 14 calendar days.
For scalping, RSI can be more useful as a momentum regime filter. In an uptrend, holding above the midline near 50 can show that bullish momentum remains intact even after a pullback. In a downtrend, repeated failures to reclaim the midline can support the opposite view. Divergence may be informative, but it is still a context signal rather than a guaranteed turning point.
Action: Use RSI to confirm or reject the momentum story already visible in price and VWAP. Avoid entering solely because RSI printed a single “overbought” or “oversold” reading.
3. ATR: the indicator that keeps volatility from becoming guesswork
ATR is one of the most useful indicators for crypto scalping because it measures the size of recent price movement without claiming to predict direction. That helps answer a practical question: is the market moving enough for the expected reward to justify spread, fees, and slippage?
ATR can also make stops and position sizing more consistent. For example, a stop that is 0.5% away may be very tight in a high-volatility altcoin and unnecessarily wide in a quiet major pair. Using a fraction or multiple of current ATR can adapt the distance to recent conditions. The exact multiplier must be tested; there is no universal value that fits every market.
Action: Track ATR alongside your actual trading costs. If the expected move is only slightly larger than round-trip costs and normal noise, the setup may not have enough room to work.
4. Bollinger Bands: useful for volatility regime shifts
Bollinger Bands are built around a moving average with upper and lower bands commonly set two standard deviations away from a 20-period basis. The visual benefit on a 15-minute chart is immediate: narrowing bands show compression, while widening bands show expanding volatility.
A common misconception is that touching the upper band means price is too high and touching the lower band means price is too low. TradingView's own documentation warns that in strong trends price can repeatedly “walk” a band. For scalpers, the bands are therefore more useful for identifying compression, expansion, and relative location than for blindly fading every touch.
Action: When bands are narrow, prepare for expansion but wait for price and participation to confirm direction. When bands are already very wide, be cautious about chasing a late move.
5. Volume: confirmation is market-specific
Volume helps show whether a breakout or directional move has meaningful participation. TradingView's volume documentation emphasizes comparing volume with recent history. That is especially important in crypto because activity can differ sharply by exchange, pair, and derivative product.
Volume should therefore be read relative to the same instrument and data source. A breakout with volume clearly above its recent local baseline may deserve more attention than one occurring on weak participation, but volume alone does not prove that a breakout will continue.
Action: Compare the current 15-minute volume bar with recent bars on the same symbol and venue. Do not assume one exchange's volume is a complete picture of the entire crypto market.
Three indicator combinations that make more sense than signal stacking
Trend-continuation setup
For a directional move, use VWAP to define bias, RSI to check momentum, and ATR to judge whether the market has enough movement. A bullish example would require price to hold above VWAP, RSI to recover after a pullback instead of collapsing, and ATR to remain healthy enough that the expected move is meaningful. Volume can then confirm renewed participation.
Action: If two indicators tell the same story because they are derived from similar price behavior, do not count them as independent confirmation. Prefer one trend tool, one momentum tool, one volatility tool, and one participation check.
Range or mean-reversion setup
When price repeatedly crosses VWAP and Bollinger Bands remain relatively contained, the market may be behaving more like a range. In that context, RSI extremes and failed pushes outside a band can be more relevant than in a strong trend. The key condition is the regime: fading an outer band during a powerful breakout can be dangerous.
Action: Before using mean reversion, confirm that the chart is actually ranging. If VWAP develops a clear slope, volume expands, and ATR rises sharply, stop treating the market as a stable range.
Volatility-breakout setup
A Bollinger Band squeeze followed by expansion can alert you that volatility is changing. ATR can confirm that realized movement is increasing, while volume can show whether participation is arriving with the move. VWAP helps keep the trade aligned with intraday direction rather than reacting to a single candle.
Action: Require a completed 15-minute candle when false breakouts are a recurring problem in your backtest. Acting before the candle closes can improve entry price, but it also increases the risk of trading a move that disappears before confirmation.
Why more indicators usually do not improve a 15-minute chart
Many indicators are transformations of the same price data. Adding RSI, Stochastic RSI, MACD, several moving averages, and multiple volatility bands can create the appearance of confirmation without adding genuinely new information. The result is often slower decision-making and rules that fit past charts too closely.
There is also an execution problem. Scalping returns are sensitive to fees, bid-ask spread, slippage, latency, and the type of order used. A technically attractive signal can still have negative expectancy after costs. This is one reason indicator performance should be tested on the specific exchange, pair, fee tier, and trading hours you actually plan to use.
Action: Remove any indicator that does not change a decision. If two tools almost always agree, keep the one that is easier to interpret and test.
Risk controls matter more than the indicator settings
The U.S. Commodity Futures Trading Commission warns that virtual currencies can be highly volatile and that leverage can amplify both gains and losses. Its customer advisory on virtual currency trading risks also notes risks including flash crashes, platform safeguards, manipulation, and cyber threats. Those risks are directly relevant to short-horizon trading because rapid moves can exceed a planned stop or produce worse-than-expected fills.
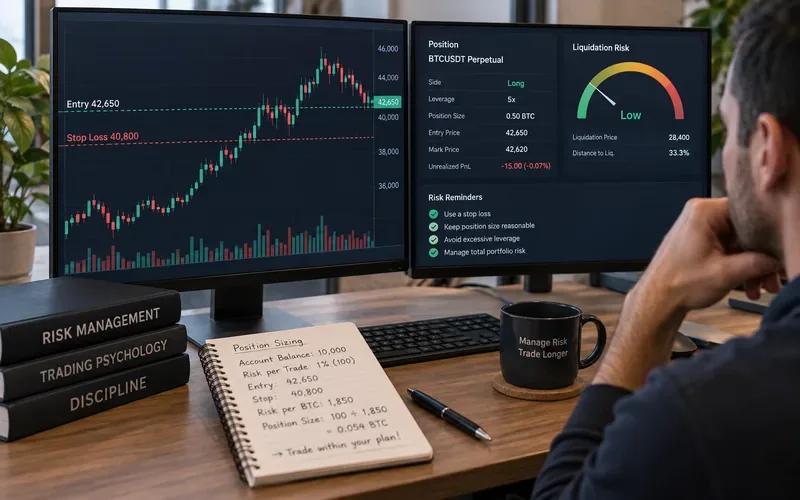
A robust scalping process should define maximum risk per trade, maximum loss per session, conditions for stopping after abnormal slippage, and whether leverage is permitted at all. Position size should be derived from the amount you are willing to lose and the actual stop distance, not from how confident the indicator pattern looks.
Action: Backtest and paper-trade with realistic fees and slippage before using real capital. If a strategy only works when costs are ignored, it is not ready for live execution.
A practical 15-minute chart template
Price chart: candlesticks with session VWAP and Bollinger Bands (20, 2).
Momentum pane: RSI (14).
Volatility pane: ATR (14).
Participation: volume bars compared with recent local history.
Optional higher-timeframe context: check the 1-hour chart for major trend or range structure before acting on the 15-minute chart.
These settings are starting points, not validated optimal parameters. Faster settings react sooner but create more noise; slower settings filter noise but enter later. The right trade-off depends on the asset, liquidity, market regime, and execution costs.
Action: Change only one parameter at a time and test it over multiple market regimes. Record win rate, average win, average loss, maximum drawdown, trade frequency, and net results after fees rather than judging settings from a few visually appealing examples.
Bottom line
For 15-minute crypto scalping, the most useful indicators are not the ones that generate the most signals. They are the ones that answer separate questions clearly: VWAP for intraday bias, RSI for momentum, ATR for volatility, Bollinger Bands for compression and expansion, and volume for participation. Their formulas and intended purposes are well established. Their future profitability is not.
The central misconception to avoid is that several indicators agreeing at once creates certainty. It does not. A better goal is to identify the market regime, demand confirmation from different types of information, control trading costs, and define risk before entry. If the setup cannot survive realistic testing after fees and slippage, changing indicator colors or adding another oscillator will not solve the underlying problem.