Home
» News
»
Volume Profile and Fixed Range Volume: How to Identify High-Volume Nodes
Volume Profile and Fixed Range Volume: How to Identify High-Volume Nodes
No verified feature change to lead with—so start with the durable idea
As of September 2026, the official TradingView documentation continues to describe Volume Profile as a tool that displays trading activity at price levels over a chosen time period. The durable lesson is more useful than a novelty: a high-volume node (HVN) is not a buy or sell signal. It is a price area where substantial trade accumulated. Fixed Range Volume Profile lets a trader choose exactly which auction or price swing is being measured, then judge whether the resulting HVNs still matter when price returns.
That distinction prevents a common error. A profile can show where trading occurred; it does not reveal the motivations of every participant or guarantee a future reaction. Use it to form a market-structure hypothesis, then require price behavior and risk control to validate it.
Educational only: this article explains chart analysis, not a recommendation to buy, sell, or hold any instrument.
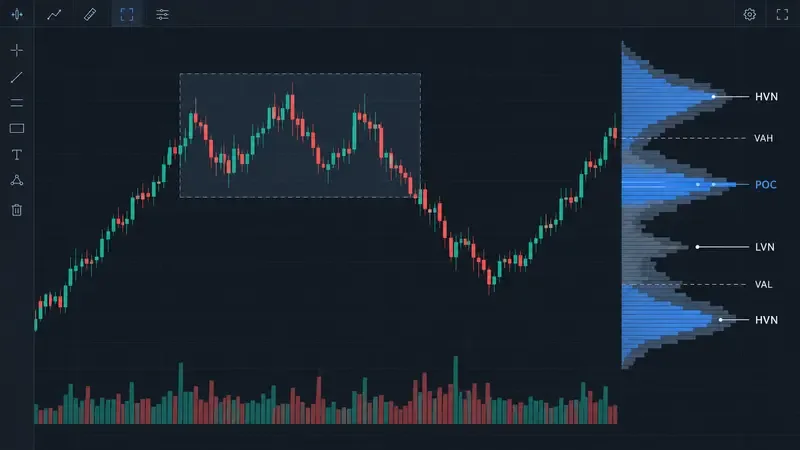
A fixed selected range produces a price-by-volume histogram: wide bulges mark high-volume nodes, while narrow sections mark low-volume nodes. This is an explanatory chart illustration, not live market data.
What Volume Profile measures—and what it does not
Most familiar volume bars answer, “How much traded during this candle or interval?” Volume Profile rotates that question: “How much traded at each price within the selected period?” The result is a horizontal histogram whose rows correspond to price bands. Longer rows indicate more recorded volume at that price band; shorter rows indicate less.
On TradingView, the profile is built from lower-timeframe data for the same symbol. The documentation also notes that the available volume type depends on the market: stocks use trade volume, while indices, forex, and crypto CFDs can use tick volume; crypto may use base or quote volume. The platform’s up/down split is derived from bar direction, not a direct record of buyer-initiated versus seller-initiated trades. Those details are not cosmetic. They set the limit of what an HVN can prove.
Practical implication: compare profiles only when the data source, symbol, and timeframe are suitable for the question. Treat an HVN in a liquid listed stock differently from a similar-looking node calculated from CFD tick volume.
The labels that make a profile actionable
Term
What it identifies
Useful question to ask
POC (Point of Control)
The row with the highest volume in the selected profile
Is price accepting or rejecting this most-traded level?
HVN (High-Volume Node)
A broad peak of volume around one or more price rows
Did price previously balance here, and is it doing so again?
LVN (Low-Volume Node)
A narrow valley with relatively little volume
Does price travel quickly through it or reject at its edge?
Value Area
The band containing a chosen share of profile volume; commonly 70%
Is price inside value, accepting beyond it, or failing back inside?
VAH / VAL
The upper and lower boundaries of the Value Area
Are these boundaries acting as acceptance/rejection decision points?
TradingView defines the POC as the price level with the highest traded volume in the period. Its Value Area calculation uses a trader-selected percentage—70% by default—then expands out from the POC by comparing adjacent rows. An HVN often includes the POC, but not every HVN is the POC. Thinking in zones rather than one exact price is usually more robust because row size and market volatility affect the apparent shape.
Why High-Volume Nodes matter
An HVN commonly represents a prior area of two-sided trade: buyers and sellers were both willing to transact there long enough for volume to build. In market-profile language, this is often interpreted as relative “fair value” or acceptance. When price returns, it may slow, rotate, or consolidate because the market is revisiting an area that previously supported substantial exchange.
That is a tendency, not a promise. A powerful directional move can cut through an old HVN when new information changes participants’ valuation. Likewise, a large HVN from months ago may be less relevant than a smaller but recent node if the market regime, earnings outlook, macro backdrop, or contract roll has changed.
Quality test: an HVN is more useful when it aligns with a clearly defined range, can be seen on an appropriate higher timeframe, and produces observable behavior on retest. It is less useful when the range was chosen only after seeing the outcome.
Fixed Range Volume Profile: choose the question before choosing the tool
Fixed Range Volume Profile is a drawing tool: you anchor its start and end around a period you want to study. That flexibility is its strength and its main source of bias. A selected range answers only the question embodied by its anchors. Before drawing it, write the question in one sentence.
“Where did volume concentrate during this multi-day consolidation?”
“Which prices were accepted during the impulse and subsequent pullback?”
“Where did the prior earnings-gap auction build or avoid volume?”
“What price areas defined the last completed swing, without including the current unfinished bar?”
Do not start by hunting for a favorable-looking HVN. Decide the market event first, then place the range boundaries at objective points such as a swing high and low, the beginning and end of a balance area, or the open and close of a completed session. Save the same anchoring rule for later reviews.
A four-step workflow for identifying an HVN
1. Define the auction you are measuring
Use a completed and meaningful range. For an intraday trader, that might be the regular session or a completed balance; for a swing trader, a whole consolidation or a prior leg. Avoid mixing unrelated events just to enlarge the sample.
2. Set profile resolution deliberately
Rows divide the price range into bands. Too few rows can merge distinct nodes into one broad bulge. Too many can make minor fluctuations look important. Change the row count and see whether the main HVN remains in approximately the same zone. If it disappears with a modest setting change, lower confidence.
3. Mark the POC, HVNs, Value Area, and nearby LVNs
Record zones, not just lines. Note whether an HVN is central to value, near VAH/VAL, or separated by an LVN. This context shapes the trading expectation: central nodes often imply rotation risk, while an HVN near an edge may become part of an acceptance or rejection test.
4. Wait for a retest and score the response
When price returns, watch for acceptance (time and trade building around the zone), rejection (a quick move away), or clean traversal. Do not assume the historical profile alone determines the outcome. A planned invalidation point and position size remain necessary.
How HVNs and LVNs work together
HVNs are often the places where price spends time; LVNs are often the places where it spends little. TradingView describes HVNs as volume peaks associated with consolidation and LVNs as valleys that can form when price moves quickly. When price approaches an HVN from outside, a useful working hypothesis is that it may pause or rotate. When it approaches an LVN, the hypothesis may be faster travel or a sharper rejection. Neither behavior is automatic.
One practical map is HVN → LVN → HVN. The two HVNs give you potential acceptance zones; the LVN between them is a potential transition area. If price accepts above the first HVN and starts holding beyond the LVN, the next HVN becomes a logical reference zone. If it fails at the LVN edge and returns into the first HVN, the original balance may remain intact.
When to change the approach
Change or supplement the profile when the evidence no longer matches the original question. Examples include a major scheduled event, a new session, a contract rollover, a structural break on the timeframe you trade, or a profile made from a range that now includes incompatible conditions. Redraw from the new event rather than stretching an old range indefinitely.
Also change the chart type before interpreting the data. TradingView warns that Volume Profile on non-standard charts such as Heikin Ashi, Renko, Line Break, Kagi, Point & Figure, and Range charts can distort prices and volume. Use standard time-based candles for an analysis intended to reflect actual traded-price structure.
Common mistakes that weaken an HVN analysis
Calling every wide row support or resistance. An HVN is historical information. Confirm the present response.
Using buy/sell language for an up/down histogram. The platform’s split is based on bar direction; it is not order-flow classification.
Changing anchors after every price move. This turns a repeatable process into hindsight fitting.
Ignoring row size. A node that exists only at one very specific row setting is fragile.
Equating a high-volume node with a guaranteed reversal. An HVN can also be crossed and later become a different reference zone.
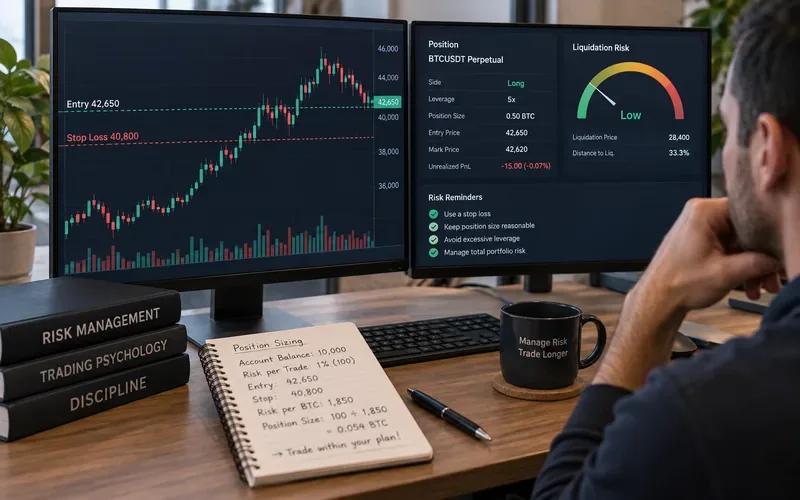
Using a single tool for risk management. Define invalidation, exposure, and event risk independently.
A compact review checklist
Is the selected fixed range tied to a stated market event?
Is the profile based on a standard chart and appropriate volume data?
Does the HVN remain broadly visible after a reasonable row-setting adjustment?
Where are POC, VAH, VAL, and the nearest LVNs?
What present-tense evidence would count as acceptance, rejection, or invalidation?
Is the trade idea still valid if the first reaction at the HVN fails?
For the platform-specific definitions and calculation limits discussed here, see TradingView’s official Volume Profile basic concepts documentation. The most repeatable use of Fixed Range Volume Profile is not predicting a single outcome. It is building a disciplined map of prior acceptance, then updating that map when current price behavior proves or disproves the idea.