Forex Session Overlap in Local Time: The 2026 DST Shift

See how U.S. and U.K. daylight saving dates shift the London–New York forex overlap, with 2026 local-time examples and a practical conversion method.
Illustrative scenario: Assume a trader borrows $10,000 at an annual funding rate of 2%, converts the dollars into euros at an EUR/USD rate of 1.10, and invests the euros at a 5% annual rate for one year. These figures are hypothetical and are used only to show the calculation; they are not current market quotes, a forecast, or a claim about any broker’s terms.
A currency carry trade earns a return from holding a higher-yielding currency or asset while funding the position in a lower-yielding currency. The interest-rate gap is only one part of the result. The exchange rate at exit can erase the interest earned, and actual financing, spreads, commissions, and margin costs depend on the instrument and provider. The Bank for International Settlements describes carry trades as cross-currency positions that seek to benefit from interest differentials while taking exchange-rate risk; leverage can make losses more sensitive to currency moves. See the BIS analysis of carry trades.
Before calculating, decide whether you want the return on the full economic position, on cash invested, or on the margin posted. Those are different denominators. The example below measures the result against the $10,000 borrowed and deployed, before tax. If a trader posts only $1,000 of margin to control a $10,000 exposure, dividing the same dollar profit or loss by $1,000 produces a much larger percentage—and reflects leverage, not a better underlying trade.
For a simple cash-funded trade, a useful framework is:
Net profit in funding currency = value of target-currency investment at exit, converted at the exit spot rate − funding-currency principal and interest − other costs.
Return = net profit ÷ the chosen starting capital or exposure.
Keep the currency units visible throughout. If EUR/USD is quoted as U.S. dollars per euro, multiply euros by EUR/USD to obtain dollars. If the quote convention is reversed, the conversion operation changes.
At the starting EUR/USD rate of 1.10, $10,000 buys approximately €9,090.91:
$10,000 ÷ 1.10 = €9,090.91
At a 5% annual investment rate, the euro balance after one year is approximately €9,545.45. Meanwhile, a 2% borrowing rate makes the dollar debt $10,200:
€9,090.91 × 1.05 = €9,545.45
$10,000 × 1.02 = $10,200
If EUR/USD is unchanged at 1.10 at exit, the investment converts back to $10,500. The result before other costs is $300, or 3.0% of the initial $10,000 exposure. This is not simply the 3 percentage-point rate difference in every market implementation; it is the result of this particular one-year example with the stated rates, timing, and unchanged spot rate.
If EUR/USD falls to 1.05, the euro has weakened against the dollar. The ending investment converts to about $10,022.73, because €9,545.45 × 1.05 = $10,022.73. After repaying $10,200, the trade loses about $177.27, or 1.77% of the initial exposure, before other costs. The higher euro interest did not prevent a loss.
If EUR/USD instead rises to 1.13, the investment converts to about $10,786.36. After repaying $10,200, the gain is about $586.36, or 5.86%, before other costs. The exchange-rate move helped the position in this case.
With these assumptions, the approximate break-even exit rate is 1.068: $10,200 ÷ €9,545.45. An exit below that level produces a loss before additional costs. This break-even calculation is a scenario tool, not a prediction of where the pair will trade.
The example explicitly models borrowing dollars at 2% and earning 5% on euros. In a real account, those cash rates may not be available to an individual trader, and the investor may use a different instrument. A spot-FX broker may instead apply an overnight rollover, swap credit, or financing debit when a position is held across its daily cutoff. The amount and sign can depend on the currency pair, position direction, value date, day-count convention, holidays, broker markup, and the broker’s funding conditions.
For a practical worksheet, record each item separately: interest or rollover earned, financing charged, bid-ask spread, commissions, conversion charges, and any fees associated with holding or rolling the position. In the example, suppose a hypothetical account incurs $45 of additional provider financing or account charges and $25 in total spread and commission. If those charges are genuinely additional to the modeled borrowing and investment rates, the EUR/USD 1.05 result becomes a loss of about $247.27, or 2.47% of the initial exposure.
Do not automatically add a broker’s swap debit to a theoretical funding-currency borrowing cost and target-currency interest yield. For many leveraged retail FX products, the rollover adjustment is the platform’s way of representing financing for the position; stacking it on top of both cash legs may count the same economics twice. Use the actual account statement and product terms to identify what has already been included. The CFTC customer advisory on OTC forex cautions customers to account for financing charges, fees, and other expenses when assessing results.
These instruments can have different delivery, margin, counterparty, and cash-flow arrangements. A return formula should follow the product actually traded rather than treating every position as a cash spot investment.
A carry trade can have positive interest income and still lose money overall. The hypothetical example shows why: a roughly 4.5% decline in EUR/USD turns a modeled 3% pre-cost gain at unchanged spot into a loss. The useful question is therefore not only “What is the rate difference?” but “What exchange-rate move, financing path, and total cost would leave this position profitable?” This calculation organizes the risks; it does not establish that a trade is suitable or predict its return.
See how U.S. and U.K. daylight saving dates shift the London–New York forex overlap, with 2026 local-time examples and a practical conversion method.
See how the 30-day wash-sale window, partial share matches, basis adjustments, Form 8949, broker reporting, and section 475(f) affect active traders.
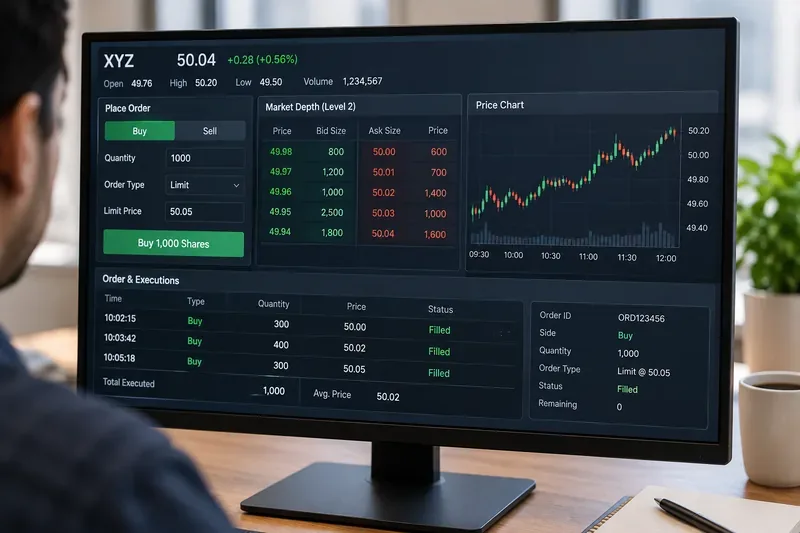
Learn why a single stock order can be partially filled at different prices and times, how liquidity and queue priority drive fills, and what to check before trading.
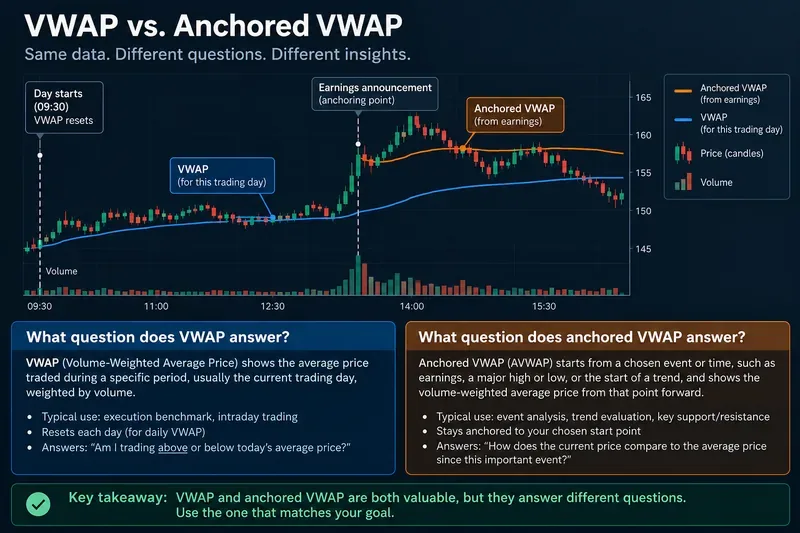
VWAP measures the volume-weighted average for a defined session; anchored VWAP starts from a chosen event. Learn when each benchmark is the better fit.
Compare market and limit orders in fast markets. Learn how fill likelihood, slippage, price limits, and queue priority affect execution—and what to check before trading.
Understand how volume profile defines the value area, VAH, VAL, and POC, what these levels can reveal, and why settings and data sources change the reading.
Learn how correlation and beta differ, why assets with the same correlation can have different market sensitivity, and what each measure leaves out.
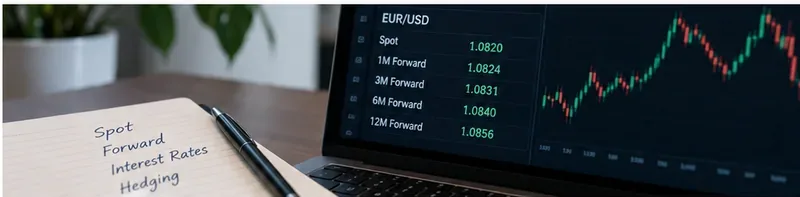
Learn what FX forward points are, how interest-rate differentials and cross-currency basis shape them, and why a forward rate is a hedge price—not a spot forecast.
Learn how to calculate currency carry trade returns by combining interest income, exchange-rate movement, rollover financing, spreads, and commissions in a worked example.
Learn how nominal and real Treasury yields differ, why real yields often matter more for gold, and how both rates affect growth stock valuations.