Home
» Knowledge
»
How to Calculate and Manage Risk-to-Reward Ratios in Crypto Trading
How to Calculate and Manage Risk-to-Reward Ratios in Crypto Trading
Risk-to-reward analysis is one of the simplest ways to turn a crypto trade idea into a measurable plan. The arithmetic has not materially changed, but execution risk deserves fresh attention: on August 18, 2026, Investor.gov updated its bulletin on stop, stop-limit, and trailing-stop orders. The bulletin is written for securities rather than crypto, yet its core execution warning is broadly relevant: a stop price is a trigger, not a guaranteed fill price. Crypto exchanges and derivatives venues can have different order rules, so traders should confirm the mechanics on the platform they actually use. See the Investor.gov stop-order bulletin.
That distinction matters because a clean 1:3 setup on paper can become a worse realized ratio after slippage, fees, partial fills, or a fast move through the stop. The goal of this guide is therefore not just to calculate a ratio, but to manage the assumptions behind it.
What does risk-to-reward mean in crypto trading?
A risk-to-reward ratio compares the amount you plan to lose if the trade is wrong with the amount you plan to make if the trade reaches its target. In this article, the ratio is written as risk:reward. A trade risking $100 to target $300 is therefore 1:3.
Some trading platforms and educators reverse the order and show reward:risk instead. The same trade may appear as 3:1. To avoid mistakes, always label the numbers rather than relying on the colon alone.
A related concept is the R-multiple. One “R” is the amount you planned to risk. If you risk $100 and make $250, the result is +2.5R. If the full stop is hit and the loss is $100, the result is -1R. R-multiples make it easier to compare trades with different coin prices and position sizes.
Step 1: Define the entry, invalidation point, and target before sizing the trade
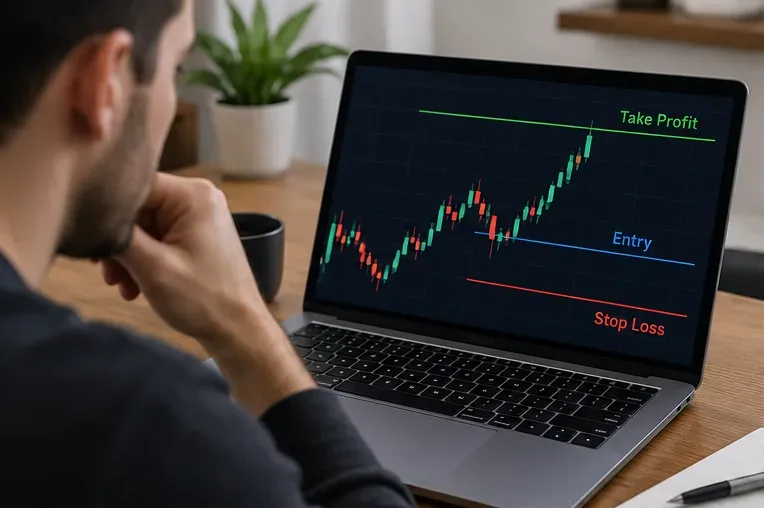
Start with the trade structure: define where you enter, where the idea is invalidated, and where you would reasonably take profit.
For a long trade, the stop is normally below the entry and the target is above it. For a short trade, the stop is above the entry and the target is below it. The stop should reflect the point where the trade thesis is no longer valid, not an arbitrary dollar amount chosen only to make the ratio look attractive.
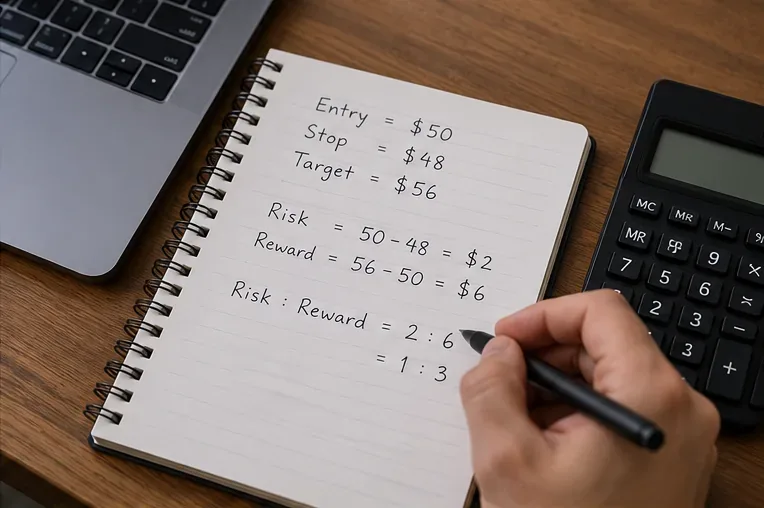
Example long setup:
Entry: $50
Stop: $48
Target: $56
The planned price risk is $2 per unit, while the planned reward is $6 per unit. That is a 2:6 ratio, which simplifies to 1:3 risk:reward.
For a short setup, use absolute price distances. If you short at $50, place the stop at $52, and target $44, the risk is still $2 and the reward is still $6, so the planned ratio is also 1:3.
Step 2: Calculate the risk-to-reward ratio
Calculate the price distance to the stop and target first; then reduce those distances to a simple risk-to-reward ratio.
For a long trade, the basic formulas are:
Risk per unit = Entry price - Stop price
Reward per unit = Target price - Entry price
Reward-to-risk multiple = Reward per unit / Risk per unit
If entry is $50, stop is $48, and target is $56:
Risk per unit = $50 - $48 = $2
Reward per unit = $56 - $50 = $6
Reward-to-risk multiple = $6 / $2 = 3
Risk:reward = 1:3
The ratio does not tell you whether the setup is likely to win. It only tells you the payoff structure if the planned prices are reached. A 1:5 setup with a very low probability of success can be less useful than a 1:2 setup that fits a tested strategy. Ratio quality and setup quality are separate questions.
Do not force every trade to meet the same ratio
It is common to hear rules such as “only take trades with at least 1:2.” That can be a useful filter for some systems, but it is not a universal law. A strategy should be judged by a combination of win rate, average win, average loss, trading costs, and consistency of execution.
Ignoring costs, the theoretical break-even win rate for a fixed reward-to-risk multiple is:
These are mathematical break-even points, not predictions. Fees, funding, slippage, taxes, missed fills, and discretionary exits can raise the win rate actually required to break even.
Step 3: Convert the stop distance into a position size
Position size should come from the account risk budget and stop distance, not from how much buying power or leverage is available.
Once the stop is defined, decide how much of the trading account you are willing to lose if the stop is executed near the planned level. This is the account risk for the trade.
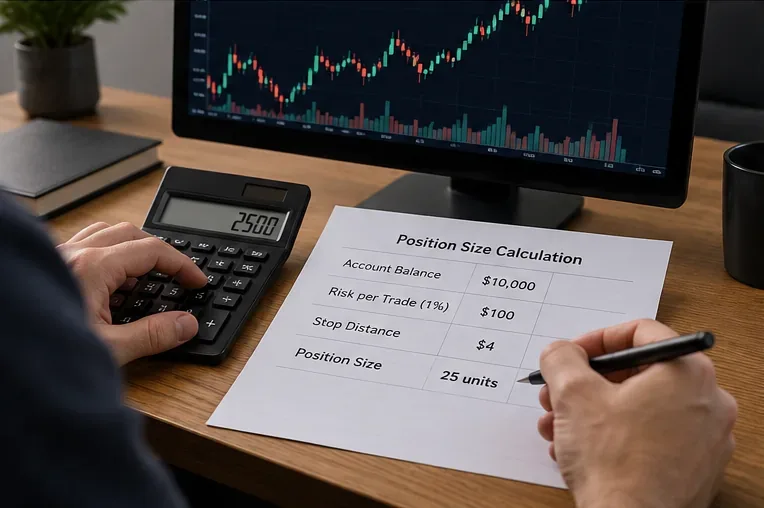
Suppose the account is $10,000 and the trader chooses to risk 1%, or $100, on a setup with a $4 stop distance per coin:
Position size = Account risk / Stop distance
$100 / $4 = 25 units
This method keeps the planned dollar loss consistent even when volatility changes. A wider stop produces a smaller position; a tighter stop produces a larger one, assuming the same risk budget.
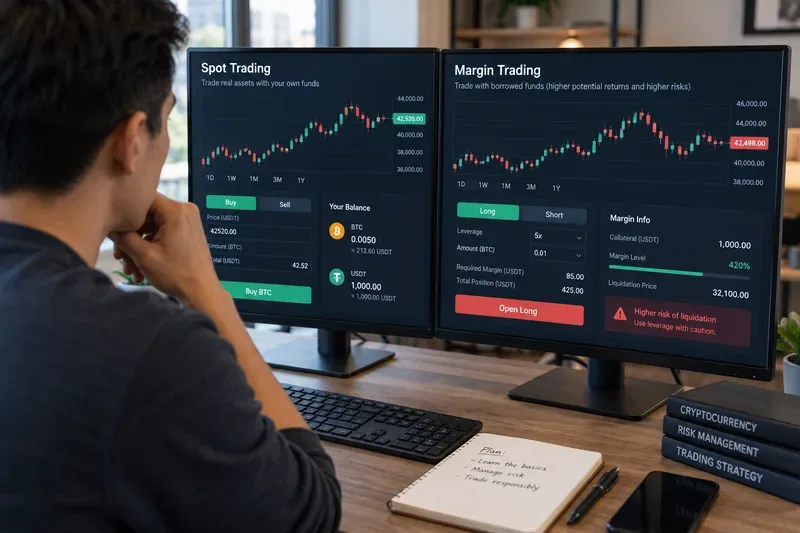
Be especially careful with leveraged crypto derivatives. The CFTC warns that leverage amplifies gains and losses and can make adverse price moves more significant. Margin posted is not the same thing as maximum economic risk. Contract specifications, maintenance margin, liquidation rules, funding, and exchange-specific risk controls can all affect the result. Review the CFTC advisory on virtual currency trading risk before using leverage.
Step 4: Adjust the planned ratio for fees, slippage, and order behavior
The textbook ratio assumes exact entries and exits. Real markets do not always provide them. To make the calculation more realistic, estimate trading costs on both sides of the position and allow for slippage where appropriate.
For a long trade, a conservative approximation is:
Adjusted risk per unit = Entry - Stop + expected entry/exit costs + expected adverse slippage
Adjusted reward per unit = Target - Entry - expected entry/exit costs - expected adverse slippage
Imagine a setup with $2.00 of raw risk and $6.00 of raw reward, but the trader estimates $0.20 per unit in combined costs and slippage across the full trade. The adjusted risk is about $2.20 and the adjusted reward is about $5.80. The original 1:3 ratio becomes roughly 1:2.64.
This is why small-target, high-frequency strategies can be more sensitive to costs than slower setups with larger price objectives.
Stop orders do not guarantee the stop price
Investor.gov explains that a stop order becomes a market order once the stop price is reached, and the execution price can differ significantly from the trigger price when liquidity is limited or prices move quickly. A stop-limit order adds price control but introduces another risk: the order may not execute at all if the market moves away from the limit. That bulletin covers securities, so crypto traders must also read the order documentation for their venue. See the Investor.gov overview of order types.
Step 5: Use R-multiples to manage exits without losing track of risk
After the trade is open, describe progress in R rather than only in percentage terms. If the original stop represents 1R and price has moved in your favor by twice that distance, the trade is approximately +2R before costs.
This makes partial exits easier to evaluate. For example, if half the position is closed at +2R and the remaining half is stopped at break-even, the gross trade result is approximately +1R. If half is closed at +1R and the rest loses -1R from the original entry, the combined gross result is roughly flat before costs.
Moving a stop to break-even can reduce downside, but doing it automatically may also cut off trades that need room to fluctuate. The right rule depends on the tested behavior of the setup, not on a universal preference for early protection.
Step 6: Track realized risk-to-reward, not just planned risk-to-reward
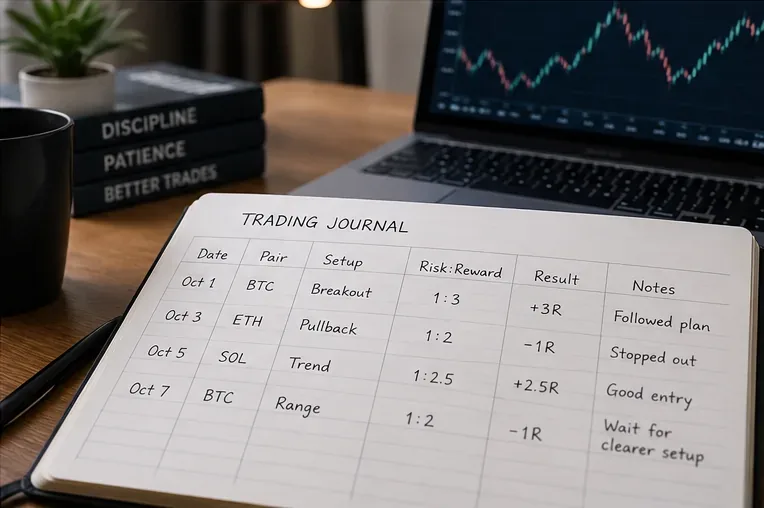
A trading journal helps compare the ratio planned before entry with the R-multiple actually realized after execution.
A journal should record both the plan and the outcome. Useful fields include:
Asset and market type, such as BTC spot or ETH perpetual futures
Entry, stop, and target
Planned risk:reward
Account risk in dollars and as a percentage
Position size and leverage, if any
Fees, funding, and estimated slippage
Actual exit price or prices
Realized result in R
Reason for any deviation from the original plan
Over a meaningful sample of trades, compare average planned R with average realized R. If a strategy repeatedly plans 2R winners but only realizes 0.8R because profits are cut early, the journal exposes an execution problem that the original ratio alone would hide.
Common risk-to-reward mistakes in crypto trading
Choosing the target first and moving the stop to manufacture a better ratio
A ratio is only useful when both stop and target are tied to a defensible market thesis. Narrowing the stop solely to transform 1:1.2 into 1:3 may increase the chance of being stopped by ordinary volatility.
Using leverage to justify a larger loss budget
Leverage changes capital efficiency and liquidation dynamics; it does not make the underlying trade safer. The risk budget should be chosen before leverage, then the position structure should be checked against margin and liquidation rules.
Ignoring correlation across positions
Three separate long positions in highly correlated crypto assets may behave like one larger directional bet. Risk per trade can look small while portfolio-level exposure is much larger. Consider total directional and sector exposure, not only individual ratios.
Treating a stop-loss as a guaranteed maximum loss
Fast markets, gaps between available prices, outages, and liquidity shortages can produce worse fills than planned. The official sources above make the execution limitation clear for traditional market order types, while crypto venue details can differ. Build some margin of safety into risk sizing rather than assuming the stop will always fill exactly.
A practical pre-trade checklist
Define the entry from the setup, not from fear of missing out.
Place the stop where the thesis is invalidated.
Choose a target that is plausible within the market structure and time horizon.
Calculate raw risk, raw reward, and the risk:reward ratio.
Estimate fees, funding, and realistic slippage.
Set a maximum account risk and calculate position size from the stop distance.
For leveraged positions, check margin, liquidation, and contract rules before submitting the order.
Write down the planned R-multiple and exit rules.
After the trade, record the realized R and the reason for any deviation.
Bottom line
Risk-to-reward ratios are most useful as a planning and review framework, not as a prediction tool. Define the trade thesis first, calculate the price risk and potential reward, size the position from an explicit account-risk budget, and then adjust expectations for real execution costs. A 1:3 setup is not automatically better than a 1:2 setup; what matters is how the ratio interacts with the strategy’s actual win rate, average realized R, costs, and consistency.
Crypto markets can be highly volatile, and leverage can magnify losses. The CFTC recommends understanding how a product can lose money and avoiding strategies you do not understand. Treat risk-to-reward analysis as one layer of a broader risk process, not as a guarantee of profit.