Forex Session Overlap in Local Time: The 2026 DST Shift

See how U.S. and U.K. daylight saving dates shift the London–New York forex overlap, with 2026 local-time examples and a practical conversion method.
As of September 25, 2026, the U.S. 10-year Treasury yield was 5.17%, while the 10-year TIPS yield was 2.83%. The gap, about 2.34 percentage points, is the market’s 10-year breakeven inflation rate. The latest observation was posted on September 28. That snapshot is useful because it separates two forces investors often blend together: the return quoted in dollars and the return after inflation.
For gold, the real yield is usually the more informative rate to watch because gold pays no coupon. For growth stocks, real yields help explain changes in valuation, but nominal yields still matter because companies report cash flows in dollars and because inflation can change those cash flows. Neither relationship is a standalone forecast.
The figures above come from the Federal Reserve Bank of St. Louis’ 10-year nominal Treasury series, 10-year inflation-indexed Treasury series, and 10-year breakeven inflation series. These are dated market observations, not a claim that either asset must move in a particular direction.

A nominal yield is the stated return measured in money terms, without adjusting for changes in purchasing power. A real yield estimates the return after inflation. A simplified relationship is:
Real yield ≈ nominal yield − expected inflation.
For example, if a 10-year nominal Treasury yields 5.17% and a comparable inflation-protected Treasury yields 2.83%, the difference is about 2.34 percentage points. In U.S. market data, the 10-year breakeven inflation rate is derived from nominal Treasury and TIPS yields. It is a market-implied measure, not a pure survey of expectations or a guaranteed forecast. Inflation risk premiums, liquidity differences, and technical market factors can affect the spread.
“Real yield” can refer to an inflation-adjusted return calculated after inflation is known, or to a market yield on an inflation-protected bond such as a TIPS. Those are related but not identical concepts. Treasury explains that TIPS principal adjusts with inflation and deflation, while the coupon rate is fixed and paid on the adjusted principal. The market price can still rise or fall before maturity as real yields change.
Gold does not pay interest or dividends. An investor comparing gold with a government bond therefore weighs the possible benefits of holding gold—such as diversification, liquidity, or a hedge against certain risks—against the income available elsewhere. When real yields rise, inflation-protected bonds offer a stronger competing return in purchasing-power terms. That can increase the opportunity cost of holding gold. When real yields fall, that hurdle can ease.
This is why analysts often watch real Treasury yields rather than nominal yields alone. A nominal yield can rise because expected inflation is increasing, even if the real return demanded by bond investors is unchanged or falling. That environment does not create the same opportunity-cost signal as a rise in real yields. Conversely, nominal yields could fall because inflation expectations fall while real yields rise; the headline rate would then give an incomplete picture of the pressure on gold.
The relationship is not mechanical. The World Gold Council’s July 2026 market commentary described gold as practically unchanged during July even as rising yields were a headwind: a weaker U.S. dollar and other factors partly offset that pressure. Its analysis groups gold drivers into economic expansion, risk and uncertainty, opportunity cost, and momentum. That framework is a useful reminder that real yields matter alongside currency moves, investor demand, central-bank activity, and market positioning.
Growth stocks are companies whose valuations often depend heavily on profits expected years in the future. A common valuation method discounts expected future cash flows back to today. The discount rate reflects the time value of money and the risk investors assign to those cash flows. If the discount rate rises while expected future cash flows stay the same, their present value falls. Because a larger share of a growth company’s estimated value may lie in the distant future, a change in long-term rates can have a pronounced valuation effect.
Real yields are useful because they approximate the inflation-adjusted return available from a low-risk bond. When real yields rise, investors may demand more return from equities to justify taking business risk, and future earnings become less valuable in today’s purchasing-power terms. The Federal Reserve’s Financial Stability Report has used the difference between the forward earnings yield on stocks and the real 10-year Treasury yield as a rough measure of the equity premium—the extra return investors require for holding stocks over risk-free bonds. It is only a broad market measure, not a valuation rule for every company.
Nominal yields still matter. A company’s reported revenue, wages, interest expense, and other cash flows are nominal dollar amounts. Higher inflation can lift nominal sales for some businesses, but it may also raise labor and input costs, financing needs, and customer strain. For valuation work, nominal cash flows should be discounted using nominal rates; real cash flows should be discounted using real rates. Mixing a nominal forecast with a real discount rate (or the reverse) produces an inconsistent estimate.
| Question | More useful first read | Why |
|---|---|---|
| Is the return on safe bonds improving after inflation? | Real yield, such as the 10-year TIPS yield | It approximates the inflation-adjusted alternative to holding a non-yielding asset. |
| Is the market repricing expected inflation? | Nominal yield alongside breakeven inflation | The nominal move may reflect expected inflation, real yields, or both. |
| Are long-duration growth valuations facing a higher hurdle? | Real yields plus the equity risk premium and company cash-flow outlook | Rates influence discounting, while growth, margins, and risk premiums can offset or amplify the effect. |
| Is a move in gold likely to follow rates? | Real yields plus the U.S. dollar, uncertainty, flows, and positioning | Gold responds to multiple forces, and the relationship can weaken or reverse over shorter periods. |
Decompose the move before drawing a conclusion. Compare nominal Treasury yields with same-maturity TIPS yields and breakeven inflation. If nominal yields rise while real yields are broadly steady and breakevens widen, inflation compensation may be doing more of the work. If real yields rise, the inflation-adjusted return on bonds is increasing, which can be a headwind for gold and can pressure long-duration stock valuations. If both rise, both channels may be active.
Then check why yields moved. Stronger expected productivity or earnings growth can lift rates while also improving corporate cash-flow expectations. A supply-driven inflation shock can raise costs and uncertainty without improving a company’s real growth prospects. A shift in monetary policy expectations can affect the whole yield curve, but the 10-year market yield is not simply the Federal Reserve’s policy rate: it reflects expectations and term premiums over a longer horizon.
Use comparable maturities and a consistent currency. A 10-year real yield is not a precise discount rate for every stock, and a U.S. Treasury yield may not be the relevant benchmark for an investor whose spending and holdings are in another currency. For growth companies, review balance-sheet debt, refinancing dates, margins, earnings durability, and how much value depends on distant forecasts. For gold, include the dollar and the investor’s home-currency exchange rate.
A rising real yield does not guarantee that gold will fall or that growth stocks will underperform. Central-bank purchases, geopolitical risk, currency weakness, strong earnings, changing risk premiums, or positioning can dominate for a time. A falling real yield is not a buy signal by itself. Market prices reflect expectations already embedded in rates, and investors may react more to a surprise than to the absolute yield level.
Nor does the 10-year breakeven rate promise the inflation rate that will actually occur over the next decade. It is derived from market prices and includes market-specific premiums. For a simple daily check, use the Treasury’s nominal par yield curve and real par yield curve, and read them alongside the Federal Reserve series rather than treating one chart as a forecast.
For gold, real yields are generally the more direct rate comparison because they measure a competing inflation-adjusted return against an asset with no income. For growth stocks, real yields help explain discount-rate pressure, but the nominal outlook for revenues, costs, debt, and future earnings matters just as much. The practical answer is not to choose one yield forever: identify whether a rate move comes from real returns, inflation expectations, or both, then test that explanation against the dollar, company fundamentals, and broader demand for gold and equities.
Data note: U.S. 10-year Treasury observations cited above are for September 25, 2026; FRED displayed them as updated September 28, 2026. Market data can be revised or change as new observations are posted.
See how U.S. and U.K. daylight saving dates shift the London–New York forex overlap, with 2026 local-time examples and a practical conversion method.
See how the 30-day wash-sale window, partial share matches, basis adjustments, Form 8949, broker reporting, and section 475(f) affect active traders.
Learn why a single stock order can be partially filled at different prices and times, how liquidity and queue priority drive fills, and what to check before trading.
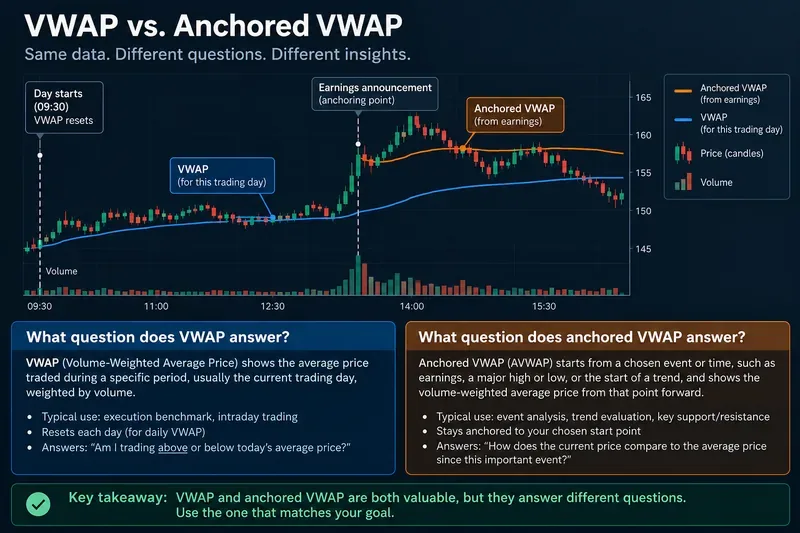
VWAP measures the volume-weighted average for a defined session; anchored VWAP starts from a chosen event. Learn when each benchmark is the better fit.
Compare market and limit orders in fast markets. Learn how fill likelihood, slippage, price limits, and queue priority affect execution—and what to check before trading.
Understand how volume profile defines the value area, VAH, VAL, and POC, what these levels can reveal, and why settings and data sources change the reading.
Learn how correlation and beta differ, why assets with the same correlation can have different market sensitivity, and what each measure leaves out.
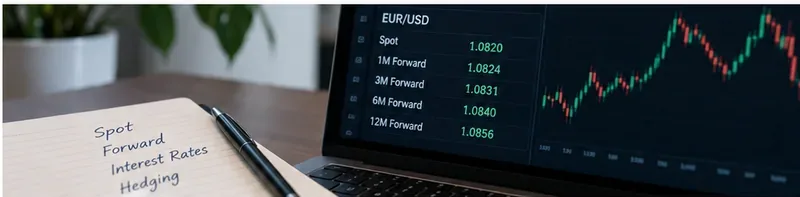
Learn what FX forward points are, how interest-rate differentials and cross-currency basis shape them, and why a forward rate is a hedge price—not a spot forecast.
Learn how to calculate currency carry trade returns by combining interest income, exchange-rate movement, rollover financing, spreads, and commissions in a worked example.
Learn how nominal and real Treasury yields differ, why real yields often matter more for gold, and how both rates affect growth stock valuations.