A stop-loss can reduce the time you stay exposed to a falling market, but it cannot guarantee the price at which you get out. The reason is mechanical: a standard stop order uses the stop price as a trigger, not as a guaranteed execution price. Once triggered, it generally becomes a market order and seeks the best available prices at that moment.
That distinction matters most when the market gaps—meaning the next tradable price is materially above or below the previous trading range, with little or no trading in between. If you own a stock with a sell stop at $95 and the next session opens near $88, there may be no opportunity to sell at $95. The stop can trigger and then execute around the available market, potentially several dollars below the stop level.
As of September 2026, the core regulatory guidance has not changed. FINRA’s March 26, 2025 investor guidance states that stop prices are not guaranteed execution prices and that a stop becomes a market order once triggered. Investor.gov gives the same basic explanation and notes that execution can differ substantially from the stop price in fast-moving markets. See FINRA’s stop-order guidance and Investor.gov’s stop-order bulletin.
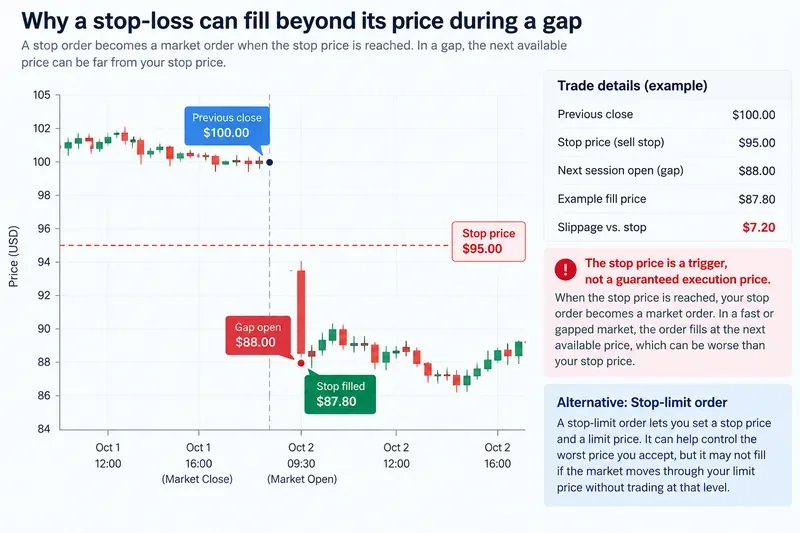
Caption: In this illustrative gap-down example, the $95 stop is a trigger rather than a guaranteed sale price. With the next available market near $88, the eventual fill can occur well below the stop.
What a good risk estimate should tell you
A useful stop-loss risk estimate should answer more than “where is my stop?” It should help you estimate three separate quantities:
- Normal stop distance: the loss if the market trades through the stop in an orderly way and your fill is close to the trigger.
- Gap slippage: the additional loss if the next executable price is beyond the stop.
- Position-level loss: the dollar impact after multiplying the adverse price move by your position size.
The estimate is good enough when it helps you size a position so that a plausible gap scenario does not create a loss far beyond what your overall risk plan can absorb. It is not a promise about the exact worst-case fill. Markets can move farther than their historical ranges, liquidity can disappear, trading can halt, and news can create jumps larger than anything in your sample.
Why a gap can skip your stop price
The stop does not reserve liquidity at the trigger
Suppose a stock closes at $100 and you enter a sell stop at $95. Nothing about that order creates standing buy interest at $95. If unexpected news arrives after the close and buyers are only willing to bid near $88 at the next open, the market has effectively jumped over the $95 level.
When the trigger condition is satisfied, the resulting market order competes for whatever liquidity is actually available. A small order in a liquid stock may fill close to the first quoted price. A larger order, or an order in a thin market, may consume multiple price levels and receive a worse average execution.
The last traded price is not the same as executable liquidity
Investors often anchor on the last print they saw. But a market order sells into bids and buys from offers. If the visible order book is thin, the price at which the full order completes can be worse than the first displayed quote.
Investor.gov’s order-type overview emphasizes that a market order does not guarantee the execution price and that the last-traded price is not necessarily the price a market order will receive.
Stop-trigger rules can differ by broker or venue
Do not assume every brokerage triggers stops from exactly the same data. Firms may define activation conditions differently, and some exchanges do not accept native stop orders even though brokers may offer them synthetically. FINRA has specifically noted that certain exchanges stopped accepting stop orders while broker-dealers may continue to offer them. Before relying on a stop, check your broker’s current order-handling documentation for trigger source, eligible sessions, after-hours treatment, corporate-action adjustments, and behavior during halts.
A practical way to estimate gap risk
The most useful approach is to estimate gap behavior from the same instrument—or from a closely matched group—using historical data, then translate that into dollars.
1. Define the loss you would have with no gap
For a long position:
Planned stop loss per share = Entry price − Stop price
If you buy at $100 and set a stop at $95, the planned loss is $5 per share before fees and execution slippage.
2. Estimate the gap beyond the stop
For historical observations where price moves through your hypothetical stop between sessions, measure the difference between the stop and the first realistically executable price. A simple approximation for a long position is:
Gap slippage per share = Stop price − Estimated fill price
If the stop is $95 and an estimated fill is $88, gap slippage is $7 per share.
Do not use only the average. Gap losses are usually skewed: many are modest, while a small number can be very large. Review percentiles such as the median, 90th, 95th, and 99th percentile of adverse gaps. If you have too few observations, treat the estimate as weak rather than pretending the percentile is precise.
3. Convert the scenario into total position loss
For a long position:
Total loss ≈ Position size × (Entry price − Estimated fill price)
With 200 shares bought at $100 and a gap-fill scenario at $88:
200 × ($100 − $88) = $2,400
Your planned stop loss was only 200 × $5 = $1,000. In this scenario, the gap adds roughly $1,400 beyond the original stop-based risk estimate.
4. Express the loss as a percentage of account equity
A dollar loss is easier to judge when related to portfolio size:
Account impact = Scenario loss ÷ Account equity
If the account is $80,000, a $2,400 scenario loss equals 3% of account equity. Whether that is acceptable depends on your own risk budget, concentration, leverage, and other correlated positions.
Use more than one gap scenario
A single “expected gap” is too fragile. A better framework uses several layers:
| Scenario | How to estimate it | What it is good for |
|---|
| Routine | Typical adverse overnight move from recent history | Day-to-day sizing |
| Stressed | 90th–95th percentile adverse gap | Testing whether normal sizing is robust |
| Severe | Largest relevant historical gaps or event-specific shocks | Understanding tail exposure |
| Beyond-history | A deliberately larger hypothetical shock | Testing whether a truly unusual event threatens the account |
The last row matters because history is not a ceiling. A company can announce fraud, bankruptcy, a failed trial, a regulatory action, or another event that produces a discontinuous move beyond past observations.
When historical gap statistics are more reliable—and when they are not
Your estimate is more informative when the sample contains enough observations from similar market conditions, similar trading hours, and the same type of instrument. It is less reliable when the asset has recently changed character, liquidity has deteriorated, the company faces a binary event, or the position is large relative to normal trading volume.
Event timing can dominate historical averages. Earnings, FDA decisions, court rulings, merger announcements, central-bank decisions, and major macro releases can produce gap behavior that differs sharply from ordinary sessions. If you knowingly hold through a scheduled binary event, use event-specific historical gaps rather than a generic volatility statistic.
Why ATR alone is not a gap-risk model
Average True Range, or ATR, is a useful measure of recent price range because it incorporates gaps into the “true range” calculation. But an ATR multiple is not a guarantee of executable loss and should not be treated as a tail-risk boundary.
ATR answers a question like “how much has this market typically been moving?” Gap risk asks a different question: “how far might the first executable price be from my stop when trading resumes?” For risk estimation, historical close-to-open gaps and event-specific jumps are more directly relevant.
How liquidity and position size change the estimate
A quoted opening price is not necessarily the average fill for your entire order. If you own 20 shares of a heavily traded large-cap stock, market depth may be ample. If you own 20,000 shares of a thin small-cap stock, your sell order could push through several bid levels.
When position size is meaningful relative to normal volume or displayed depth, use a more conservative fill assumption. At minimum, examine:
- Average daily volume and typical opening volume.
- Bid-ask spread during ordinary and stressed periods.
- How many shares tend to trade near the open.
- Whether the security has frequent volatility halts or thin premarket trading.
- Your position as a percentage of typical volume.
A stop may manage directional exposure, but it does not create liquidity.
Would a stop-limit order solve the problem?
A stop-limit order changes the trade-off rather than eliminating risk. Once the stop is triggered, the order becomes a limit order instead of an unrestricted market order. That gives you price protection: you specify the worst price you are willing to accept.
The cost is execution uncertainty. If a stock gaps below your sell limit and never trades back to it, the order may remain unfilled while the market keeps falling. FINRA’s 2025 guidance explicitly highlights this distinction: stop-limit orders can help control execution price, but there is no guarantee the order will execute.
A stop-limit order is therefore more suitable when price control matters more than immediate exit. A standard stop may be more suitable when the priority is to leave the position once the trigger is hit, accepting that the fill can be materially worse.
Signs your current stop-loss plan needs adjustment
Revisit your approach when any of the following is true:
- Your position would exceed your intended risk budget under a realistic 90th or 95th percentile gap.
- You are holding through a scheduled event that has historically produced much larger jumps than ordinary sessions.
- The security’s liquidity has fallen or your position has become large relative to normal volume.
- You assumed the stop price was guaranteed rather than merely a trigger.
- You chose a stop-limit order but your real priority is immediate exit.
- You use leverage and a severe gap could create losses well beyond the amount you planned from the stop distance alone.
The cleanest adjustment is often position size. A wider statistical gap assumption combined with a smaller position can keep account-level risk within the same budget without pretending the stop itself has become more precise.
A compact formula for position sizing with gap risk
If you choose a conservative estimated fill price for a long position, a simple sizing formula is:
Maximum shares = Dollar risk budget ÷ (Entry price − Stress fill price)
Suppose your risk budget is $1,000, your entry is $100, your stop is $95, but your stressed gap analysis suggests using an $88 fill assumption. Then:
$1,000 ÷ ($100 − $88) ≈ 83 shares
By contrast, sizing only from the $5 stop distance would produce 200 shares. The difference shows why gap assumptions can matter more than the stop level itself.
This calculation is still only a scenario estimate. It does not include commissions, taxes, borrow costs, market impact, partial fills, extraordinary halts, or a move worse than the stress price. Those limitations should remain visible in any risk plan.
The outcome to aim for
A strong stop-loss process does not try to predict the exact fill. It produces a position size that remains tolerable across a range of plausible execution prices.
You should be able to state, before entering the trade: your stop trigger, the fill price you assume in a routine case, a stressed gap-fill estimate, the resulting dollar loss, and the percentage of account equity at risk. If you cannot tolerate the stressed number, change the position size, avoid the event window, reconsider the order type, or do not take the trade.
The key limitation is unavoidable: a stop can automate an exit instruction, but it cannot guarantee liquidity at the stop price. Gap risk is therefore best managed before the trade—through scenario analysis and position sizing—rather than assumed away by the presence of a stop order.